Let’s Talk About Stats: Methods for Comparing Two Sets of Data
Researchers must show the statistical accuracy, validity, and significance of their data. So here are two ways to compare two sets of data.
Join Us
Sign up for our feature-packed newsletter today to ensure you get the latest expert help and advice to level up your lab work.

Researchers must show the statistical accuracy, validity, and significance of their data. So here are two ways to compare two sets of data.

Are you having problems amplifying GC-rich regions in your PCR reactions? Read this article for 5 easy tips to address these issues!

Don’t be fooled by bad data. Make sure your results are reliable with this quick guide to determining LOQ and LOD in Excel.

Have you ever wondered what it would be like if someone helped you step-by-step through your job search? A good recruiter does exactly that! Recruiters provide value to job-seekers by reviewing resumes, finding jobs that may be a good fit, and providing interview tips. But how does that process work? In this article we’ll cover…
In the last years, the need for using statistical testing in bioscience has grown exponentially and so has the development of statistical software. It is now common that everyone is using some sort of stats in their basic research. Among the skillful biostatisticians, R is the most popular software for data analysis, but not all…
When it comes to data analysis and interpretation, you need to be very clear about the meaning of a given p value and be aware of all its intrinsic limitations.
In my first article on this topic we delved into what miRNAs are, how they are generated, and their function. Now, we are going to discuss how to identify miRNAs and their targets. Why Do You Want to Look at Something So Small Anyhow? miRNAs play a crucial role in most physiological processes. It’s not…
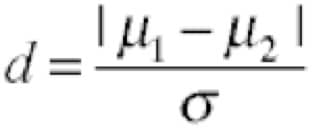
To draw a convincing conclusion from your data, you cannot simply shoot for the standard significance cutoff. You also need to consider the statistical power, which is determined in part by the sample size in your experiment.

Microsoft Excel can be a really powerful, useful tool for certain kinds of data processing and record keeping, and the chances are you probably don’t even know how to use half of the functions it comes with! That’s OK, personally, I find Excel a bit less user-friendly than Word, but also it’s a programme I…
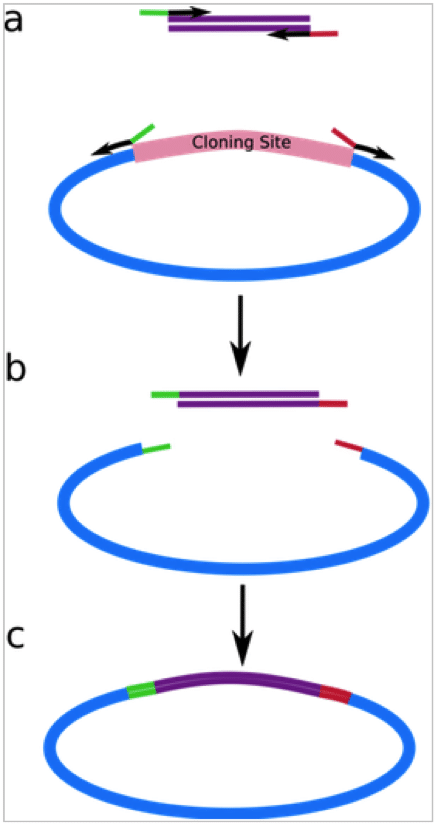
PIPE PCR is a ligase-independent, restriction enzyme-free cloning strategy like SLIC (link to my SLIC article), SLiCE and CPEC. The PIPE method eliminates sequence constraints and reduces cloning and site mutagenesis to a single PCR step followed by product treatment. It is fast, cost-effective and highly efficient. The key step is designing the primers; one…

Now that we’ve learned about the role of apoptosis in good health and disease, it will be useful to know how we can detect apoptosis in cells or organisms. A variety of apoptosis detection kits are commercially available, and here is a roundup of how they work: TUNEL and DNA damage assays The TUNEL assay…

Your lab is full of non-chemical hazards that can explode, stab, kill, and – as if that wasn’t enough – bite. Here’s a list of those hazards to remind you why Environmental Health & Safety exists! 1. Centrifuges Centrifuges are dangerous, especially when not cared for! An unmaintained ultracentrifuge imploded in an American lab in…

The thing that was most difficult for me as an R beginner was plotting graphs with error bars – there is no concise way to do this with base graphics. There are workarounds, often using the ‘arrows’ command, but isn’t there a simpler way? Yes, in fact there are a handful of plotting packages for…

We’ve been slowly coaxing you along in our R tutorials. We’ve introduced what R is, gave you a basic tutorial into how to use R and also spent some time learning how to explore your data with R. By now you are probably itching to use R for more complicated analyses. To indulge you, I…

As you’ve probably kind of guessed from our previous articles Introducng R and the Basic R Tutorial, we think R programming language and R-studio are great tools for data analysis and figure production. And now we are about to prove it! So, you’ve collected some data and are pretty sure you know what statistical test…

So you’ve performed a test such as an ANOVA and have found that there is statistical significance in your data (lucky you!), however you now want to know where that significance lies. When you are comparing multiple sets of data it might seem like a logical thought to simply perform an individual t-test between each…

Last week I focused on the left-hand side of this diagram and talked about statistical tests for comparing only two datasets. Unfortunately, many experiments are more complicated and have three or more datasets. Different statistical tests are used for comparing multiple data sets. Today I will focus on the right side of the diagram and…

The first hurdle in learning about statistics is the language. It’s terrible to be reading about a particular statistical test and have to be looking up the meaning of every third word. The type of data you have, the number of measurements, the range of your data values and how your data cluster are all…

Scientific success is often defined by how well your experiments progress and the results you produce. However, scientific research is driven by a curiosity about the unknown, and you cannot always be prepared for the unknown. Inevitably there will come a time when your experiments fail. In this article I give you some of the…

This guide is full of very simple but effective tips so you can have a pleasant lab experience, and help create a happy lab.

Math is an important part of lab life, from making solutions to calculating protein concentrations, and miscalculations can cause mayhem for your experiments. Therefore it is important that your math is right, or you could spend weeks trying to figure out what’s going wrong in your experiments. I was hopeless at remembering how to do…

In the previous article, I showed you how to interpret mean-squared displacement (MSD) and showed four easy things you can learn from an MSD graph at a quick glance. Now let’s turn from analyzing an MSD plot to making one. I am going to use the programming language R to generate simulated data and then…
Stuff moves. It is useful to study how stuff moves, because motion analysis can tell us a lot about the object that is moving. For example, we can learn if an object’s motion is aimless, diffusive wandering, or directed towards some goal, free to explore the available environment, or restricted to a confined space. Studying…

So now you’re convinced that R is the language for you, you’ve downloaded R-Studio (from https://www.rstudio.com/) and opened it, and. . .what the hell do you do now? Great question! I always find it easiest to learn by doing something, rather than just by seeing a list of possibilities, so here I’ll walk you through…
Working with large datasets can be very frustrating and time consuming. If only there were more tools out there to simplify things without needing to invest a PhD’s worth of time to learn how to use them! I am here to tell you that there is a solution, and a free one at that. If…

Like many scientists, I don’t consider myself a statistics expert. But I am determined to do things right in my science, and that includes statistics. In my experience, a lot of scientists who are “scared” of statistics fall into the trap of ignoring the existence of anything beyond a t-test. But using the right method…

To pull together our discussions so far on hypothesis testing and p-values, we will use the t distribution as an example to see how it all works. The t distribution (you may have heard it called Student’s t) is a probability distribution that looks like a bell-shaped curve (or normal distribution). If we sample repeatedly from…

Now we come to the third part of our trifecta; in the last two posts I have gone over p-values and how they determine significance in null hypothesis testing, and we talked about degrees of freedom and their effect on the p-value. Finally, we come to pseudoreplication: where it can all go terribly wrong. Replication…
In the previous article in this series, we covered teamwork and networking. Now it’s time to move on to what many people consider the most boring part of the lab work: the analysis. I know we all wish that a simple histogram or a rather nice-looking Western blot or PCR would suffice. But the fact…

In the last post I talked about p-values and how we define significance in null hypothesis testing. P-values are inherently linked to degrees of freedom; a lack of knowledge about degrees of freedom invariably leads to poor experimental design, mistaken statistical tests and awkward questions from peer reviewers or conference attendees. Even if you think…

In previous articles, I’ve primed you on hypothesis testing and how we are forced to choose between minimising either Type I or Type II errors. In the world of the null hypothesis fetish, the p-value (p) is the most revered number. It may also be the least understood. The p-value is the probability, assuming the…

This column is loaded with pop quizzes for you to test yourself on. If you haven’t already done so, catch up on yesterday’s piece on hypothesis testing for a refresher. Take a gander at the table below for a summary of the two types of error that can result from hypothesis testing. Type I Errors occur…

Hypothesis testing is the foundation around which we prove our science is worth funding, publishing and sitting through a conference presentation for. I can’t overstate the importance of understanding hypothesis testing, such is the integral part it plays in biological analyses. The Null Hypothesis Fundamental to statistics is the concept of a null hypothesis, and…

In this, the first in a series of articles on statistics, I want to set out some of the main reasons why you, as a biologist, should improve your knowledge of statistics. The general consensus is that biologists are not strong when it comes to statistics. There’s nothing in our brains that stops us from…

….statistics. The very word strikes fear into the heart of many a biologist (including me). In an article published earlier this year, Cumming and co-workers of La Trobe University, Melbourne gave a very useful rundown of common mistakes made when using statistical error bars in biology and suggested a number of rules that should be…

The eBook with top tips from our Researcher community.