Before rolling up your sleeves for a new experiment, you need to ask this question: What should the sample size (N) be to get a statistically reliable measurement? This is one of the most extremely important and commonly asked questions by junior students or even senior postdocs in the lab.
Statistical testing provides the judgement to decide whether the results from your experiment lead to a new finding or not (i.e., do we reject or accept the null hypothesis). However, to draw a convincing conclusion from your data, you cannot simply shoot for the standard significance cutoff, p<0.05. You also need to consider the statistical power, which is determined in part by the sample size in your experiment. Indeed, a low power test will very likely give you a spurious effect, that is, the significant result (p<0.05) you obtained will very likely be wrong.
What is the statistical power?
Statistical power is the probability to detect an effect when the effect truly exists (e.g. the probability to discover that insulin reduced blood glucose levels when insulin indeed will lower blood glucose concentration). For example, a test with statistical power of 0.8 means the test has an 80% chance to detect the real effect if it exists; while a test at power of 0.2 indicates there is only a 20% chance of detecting the effect.
Mathematically, statistical power is defined by the formula, statistical power=1-β, where β is the type II error rate or the false negative error rate (failure to detect the effect that insulin decreases blood glucose level). Therefore, when conducting an experiment with high statistical power, you are less likely to commit the type II error that the effect is true but we fail to detect. In other words, the probability of detecting the effect (insulin reduces glucose level) is higher in a high power test.
What determines the statistical power?
3 main factors determine the statistical power: effect size, sample size, and alpha level.
1. Effect size (d)
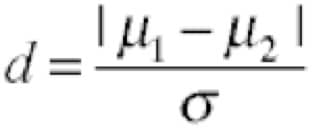
The effect size of the difference between two groups is defined by the formula:
μ1: the mean of the first group
μ2: the mean of the second group
σ : standard deviation of the population
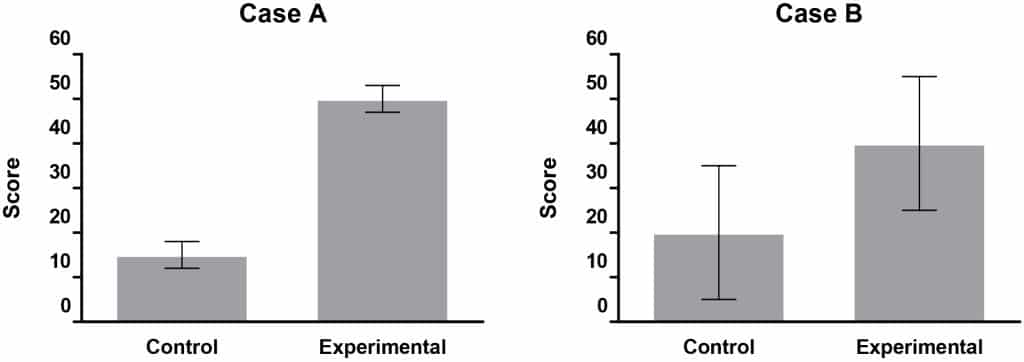
Clearly, as the difference between the group means (Δμ) increases or the standard deviation decreases (Case A vs. Case B), the more likely the test can detect the effect (statistically significant result). The larger the effect size (d), the more powerful the statistical test will be.
2. Sample size
Obviously, the more sample you take from a population, the more representative the sample will be for the whole population. And the more accurate the estimated effect size will be for the true effect. As opposed to effect size, which is the intrinsic feature of the samples, you can increase the statistical power by increasing the sample size in your experiment.
3. Alpha (α) level
the type I error rate or the level of significance in the test. This level is usually set at 0.05. Intuitively, as we reduce the alpha level to 0.01 rather than 0.05, the less likely the test can detect the effect (p<0.01 is harder to achieve than p<0.05). The more stringent the α level, the less powerful the test will be.
Statistical power also affects the reliability of a statistically significant finding
A test with high statistical power does not simply mean it is more sensitive to detect the real effect. It also increases the likelihood that an observed statistically significant result (p<0.05) reflects a true effect. This is defined as positive predictive value (PPV). Where PPV
1 – β: the statistical power, β is the type II error rate.
α: the type I error rate, usually set at 0.05.
R: the ratio of the proportion of real effects over the proportion of null effects.
For example, suppose you are working in a field where 20% of the effects are true, and 80% are null (R=0.20/0.80=0.25). You conduct two different experiments: one has 0.8 statistical power while the other only has 0.2. Let’s use alpha level 0.05 to assess their significances. The high power test will give us a PPV=
This means you have an 80% chance that the significant result (p<0.05) you get from the test will be a true effect.
On the other hand, when we run the low power test, the PPV will be
Thus, you only have a 50% chance to accurately claim that you found an effect if your experiment result is significant (p<0.05). Indeed, when the statistical power is low, the p is a fickle value and the significant effect you found will be pretty much meaningless.
A free downloadable statistical software for performing power analysis
To manually calculate the statistical power of your data or determine the required sample size for the experiment is a pain. Fortunately, there is a free statistical package you can use to perform power analysis. This freeware, called G*Power, can be downloaded and used in both PC and Mac formats to conduct several different types of power analyses (t tests, F tests, χ2 tests, z tests and some exact tests).
G*Power is a freeware that includes plenty of useful features for power analysis. In the next article, we will dig into some of those useful functions and find out how it can help us better design our next experiments and interpret collected data.
Further Reading
Nature Method published a series of free access “point of significance” articles digging deep into the core of statistical concepts that would be of great interest for scientists.


