This article provides a quick taster of their advice to try and make things seem a little less scary!
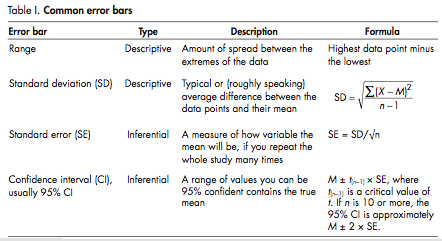
Two types of error bars are commonly used in biology. Descriptive error bars used to describe a data set and inferential error bars used to determine which conclusions can be justifiably drawn from a data set. These are summarized in the table on the right, which is taken from the paper.
Cumming et al suggest 8 rules that should be applied when presenting data:
1. When using error bars always describe what type they are in the figure legend
2. The value of n (the sample size) should always be stated in the figure legend
3. Error bars and statistics should only be shown for independently repeated experiments and never for replicates. If a “representative” experiment shown, it should not have error bars or P values because in such an experiment n=1
The reason for this rule is summed up quite well in the paper:
“Consider trying to determine whether deletion of a gene in mice affects tail length. We could choose one mutant mouse and one wild-type mouse, and perform 20 replicate measurements of each of their tails. We could calculate [the mean and error bars], but these would not permit us to answer the central question… because n would equal 1 for each genotype, no matter how often each tail was measured”.
4. Because experimental biologists are usually trying to compare experimental results with controls, it is usually appropriate to show inferential error bars such as standard error or confidence interval, rather than standard deviation. However, if n is very small (e.g. n=3), rather than showing error bars, it is better to simply plot the data points.
5. 95% confidence intervals capture mu (the actual average of the population) on 95% of occassions, so you can be 95% certain your interval includes mu. SE bars can be doubled in width to get the approximate 95% CI, provided n is 10 or more. If n=3, SE bars must be multiplied by 4 to get the approximate 95% CI.
6,7. Rules 6 and 7 relate to determining whether data points with overlapping error bars are statistically different. This requires a bit more background explanation than I have mentioned here so it’s worth looking at the paper if you are interested in this.
8. In the case of repeated measurements on the same group (e.g. of animals, individuals, cultures or reactions), confidence intervals or standard error bars are irrelevant to comparisons within the same group.
For someone like me who as always found statistics a bit of a mystery, this paper is a real eye opener. I’d encourage you to take a look – the link is below, along with links to other websites I found very helpful in getting my head around this stuff. If you’ve got anything to add – or have got anything wrong here (it’s not my area at all!), please feel free to leave a comment.
Further Reading:
- Cumming et al The Journal of Cell Biology 177:1 p7
- Statistics tutorial from www.physics.csbsju.edu
- Descriptive statistics tutorial from the University of Edinburgh


