
Thanks to the abundance of experimental protein structures in databases such as the Protein Data Bank, we take it for granted that protein structures are knowable.
But knowing or solving a protein structure, usually achieved using X-ray crystallography, takes a lot of work.
So what is protein crystallography? What goes into it, what information does it provide, and what can go wrong?
Whether you are about to enter the world of protein crystallography or work with a protein crystallographer on your grant, this article will be useful.
Choose a free resource to help you move forward
EBOOK
Free Guide to Protein Expression
DOWNLOAD
Western Blot Troubleshooting Card
What Is Protein Crystallography?
We use protein crystallography to determine, experimentally, the structure of proteins. The method applies to other macromolecules, such as nucleic acid and viruses.
Accurate structures of proteins assist in developing drugs to fight disease, understanding biological processes, and technological applications such as protein engineering and biocatalysis. [1]
All structural data for every protein solved sits in online repositories and is free for scientists to access and interrogate. In that respect, the technique and its data are helpful for their own sake.
Two essential structural repositories worth knowing are:
- The Protein Data Bank for macromolecular structures.
- The Cambridge Structural Database for organic and organometallic chemical structures.
How Does Protein Crystallography Work?
It’s astonishingly complicated. I’ll do my best to simplify it, avoiding jargon and maths.
X-ray Diffraction Basics
When you put a crystal in a narrow beam of X-ray photons traveling in the same direction (collimated), a small percentage interacts with the crystal, and the rest passes through it.
X-rays that interact with the crystal experience a change in some of their properties. Properties that change include:
- Position.
- Amplitude.
- Phase.
We call these changes “diffraction,” and these changes depend on:
- The smallest portion of the crystal with no internal symmetry.
- The symmetrical arrangement of these units in the bulk crystal.
We collect all the diffracted X-rays in a diffraction pattern in the X-ray diffraction experiment.
The Asymmetric Unit
The smallest portion of the crystal with no internal symmetry is called the asymmetric unit. It contains one to potentially dozens of structurally unique protein molecules.
And structurally unique means not having a symmetrical equivalent anywhere else in the crystal.
The differences between molecules within the asymmetric unit may be tiny and insignificant, but they exist.
The asymmetric unit also contains all the water molecules hydrogen bonded to the protein molecules and solvent.
Because the asymmetric unit contains all the structurally unique atoms and molecules, it’s the bit crystallographers have to build.
Woe betide the protein crystallographer with many copies of their protein in the asymmetric unit.
Symmetry operations are then applied to the asymmetric unit to describe the entire crystal. Or, to put it another way, a crystal is an almost perfectly symmetrical arrangement of asymmetric units (like a Rubik’s cube).
Four Transforms: A Mathematical Lens
Anyway, all that is jumping ahead a little bit.
Changes happen to X-ray photons, and they happen because of the protein structure.
These changes obey a mathematical transform called the Fourier transform. It’s a beast of an operation, and we don’t need to know it.
The crucial point is—it is known.
Suppose we could reverse the Fourier transform. Take the diffracted photons, changes and all, feed them back into the function, and do something to it that got us back to the state before the changes occurred.
After all, the changes happened because of the protein structure and are expressible mathematically.
That’s what happens in protein crystallography. We measure the diffracted X-rays, quantify them, feed them back into the Fourier transform, and raise it to the power of minus one (reciprocate it).
This process results in a three-dimensional map of all the electron densities (where electrons are) in the asymmetric unit.
And since electrons orbit atomic nuclei or exist between them in bonds, the electron density map is, roughly speaking, a ball-and-stick model of the protein structure.
Or rather, it’s like a silhouette of a ball-and-stick model. The crystallographer has to describe what atoms go where and with what geometry.
Sounds great, right?
The Phase Problem
It is, but there’s a massive problem.
To reciprocate the Fourier transform and deduce an electron density map, we require the following information:
- The relative position of the diffracted waves.
- The relative amplitudes of the diffracted waves.
- The relative phases of the diffracted waves.
We can directly measure the first two using an X-ray detector. All the diffracted X-rays hit the detector with a definite position and produce a signal proportional to their amplitude.
But we lose all the phase information. Nor can we measure it directly or indirectly.
This is called the phase problem.
Ways Around the Phase Problem
We don’t just pack it in and go home because of the phase problem. It’s a difficult, but not insurmountable, issue.
The two most common ways of overcoming the phase problem in protein crystallography are Molecular Replacement and SAD phasing.
Molecular Replacement
We can take the phases from another structure that resembles the one we are trying to solve. Combine them with the symmetry of the new crystal, and do the inverse Fourier transform.
With some luck, we get an electron density map with interpretable features.
There is a streamlined process for this called Molecular Replacement. [3]
SAD Phasing
SAD stands for Single-wavelength Anomalous Dispersion.
It exploits two properties of diffraction patterns:
- Every single atom contributes to every bit of the diffraction pattern.
- Atoms with lots of electrons make the greatest contribution to the diffraction pattern.
In SAD phasing, heterogeneous heavy atoms, such as osmium or cadmium, are introduced to the crystal.
Typically, the crystal is soaked with a dilute solution of heavy atom salts, and then we pray it doesn’t crack or dissolve. Note that the heavy atoms must bind to the protein in an ordered and definite manner for the technique to work.
Or lately, selenomethionine is incorporated into the protein during over-expression. A methionine auxotroph is grown in the presence of selenomethionine, and selenium serves as the heavy atom.
Then, we collect a diffraction pattern like normal.
The gist of SAD phasing is that incident X-rays may eject inner-shell electrons from the heavy atoms. Outer-shell electrons then fall into the “gaps” left by the ejected electrons, and the energy that decays is released as an additional X-ray photon.
These additional X-ray photons alter the intensity of the signal produced for all the other diffracted X-rays.
The heavy atoms can be located by measuring the magnitude of these differences and exploiting the two properties measured above, narrowing down the choice of phases needed to solve the structure. [2]
Why?
Because if we can locate the heavy atoms, we cannot choose phases that add or subtract significant electron density from the heavy atom regions (because they exist and are real).
What Information Do We Get from Protein Crystallography?
In a successful case, you get an atom-by-atom model of the protein structure and a set of statistics that tell you roughly how accurate it is.
Depending on the quality of the data, you may get some bonus information, such as the water molecules that form part of the quaternary structure.
Or you may be able to tell if a disulfide bond has formed or if an amino acid is modified.
You’ll usually be able to see if the protein is bound to a ligand, but accurately building the ligand into the model might be difficult.
The granularity and information-richness of a structure largely depend on the resolution of the diffraction data.
Data Resolution Versus Useful Information
A crystallographic resolution is the minimum distance at which two contributors to the electron density map (atoms) can be confidently distinguished.
Because most atoms have a van der Waals radius of 1.0-2.0 Å, we can organize crystallographic resolution according to the following table.
Resolution | Structure properties |
<1.5 Å | So-called “atomic resolution.” Atoms appear as well-separated spheres. Consequently, the structure should have few errors. Water molecules are visible. |
1.5-2.5 Å | The structure looks like spheres that have melted together a bit. Side chain rotamers become harder to model but should still be correct in most cases. Loop regions are usually accurate, also. |
2.5-3.5 Å | Water molecules stop becoming visible in the electron density maps. The chances of incorrectly modeling side chain rotamers also increase. Loop regions may be incorrectly modeled. |
>3.5 Å | Hard to accurately model anything but secondary structure. The structure should be treated with caution. Above 4 Å, making observations that rely on atomic coordinates is dubious. |
Note that the resolution is “local.” Structures may have good and bad bits, but the difference between the highest and lowest resolution regions won’t be huge. Perhaps a few-tenths of an Angstrom at most.
Check out Figure 1 below for an illustration of electron density for a porphyrin ring at 0.93 and 3.5 Å.
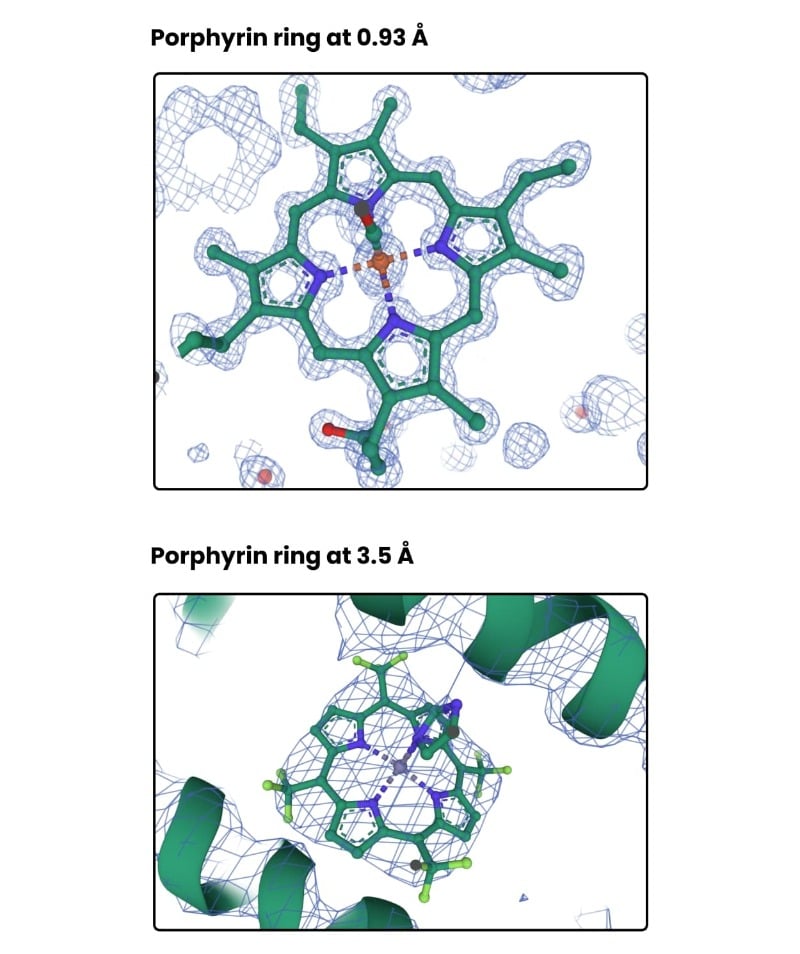
See how, in the top image, the electron density (shown as blue mesh) is roughly a sphere around each atom. In the bottom image, the density for the entire porphyrin ring is a blob with few features.
If the porphyrin ring ligand didn’t possess 4-fold symmetry or we didn’t know to expect a porphyrin ring in the structure somewhere, it would be hard to build accurately into the electron density. That’s to say, prior knowledge is a boon.
Notice also that in the top left-hand side of the top image, there is electron density that clearly belongs to the side chain of a phenylalanine residue (sidechains were turned off for image clarity).
What Can Go Wrong with Protein Crystallography?
A lot. Take a look.
Sample Cloning and Expression
Readers will know the issues that arise during cloning and protein expression. There are a dozen ways PCR can fail, and that’s before you’ve ligated the insert into the vector, cleaned it up, and done the transformation.
Sample Purification
What goes into sample purification?
A lot of buffers, a lot of column chromatography, a lot of centrifugation, dialysis. And a whole lot more.
Plus, your sample may be delicate. It could get chewed up by proteases, chew itself up, precipitate out with the slightest manipulation, and precipitate out slowly over time.
Add all that up and then factor in gross human error, and you start to see the picture.
Sample Crystallization
Getting a protein to crystallize can be arduous. Or it can be laughably easy and happen before your very eyes.
To say it’s a random shotgun process is inaccurate. But that’s not to imply it’s a predictable one.
Usually, you mix the purified protein with chemical conditions that have crystallized similar (in function and/or shape) proteins.
But because this is not guaranteed to work, the entire protein crystallization experiment is miniaturized down to a few hundred nanoliters.
That’s to say, if you have purified your sample successfully, the battle isn’t over. In fact, you’re not even on the battlefield yet!
Crystal Damage During Handling
For all the sophisticated kit that goes into protein crystallography, particle accelerators, and precision optics, you still have to manipulate the crystals by hand—with acupuncture needles.
Acupuncture needles look blunt next to a two-hundred-micron crystal and seem like unwieldy cudgels.
It’s easy at this stage to accidentally crush the crystal.
Crystal Damage in X-ray Beam
The X-ray beam is energetic enough to give a human a lethal dose of radiation in a heartbeat. That’s why the diffraction experiment takes place in a concrete bunker.
Needless to say, the crystal is pretty much useless after a diffraction experiment unless there’s room for another go at it and the X-ray beam is narrow enough.
It’s common to see the diffraction pattern deteriorate enough in real-time during the diffraction experiment because of free radicals introduced into the crystal. These are incredibly reactive and wreck the protein molecules.
Unfortunately, protein crystals diffract X-rays poorly, so dispensing with high-energy X-rays is impossible.
Poor Crystal Quality
Some crystals are just bad crystals. They can be really gap-ey, delicate, or not very crystalline (even though they may look perfect).
Going from the first crystal to a better crystal to a structure-grade crystal may take years. And it’s not as if the crystallographer knows if they have grown better crystals until they can fire some X-rays at them—an opportunity for which they might have to wait months.
Crystal Data Pathologies
And if you’ve navigated that mire, other lurking data germlines can give you a headache.
The main culprit is non-crystallographic symmetry. This occurs when multiple copies of a protein occupy the asymmetric unit and look as if they are symmetrically related but aren’t.
Spotting it can be hard enough. And if you can’t factor it in, it can skew all the structure-validation statistics.
The Power of Protein Crystallography
Grafting away to get a crystal structure can be worth it.
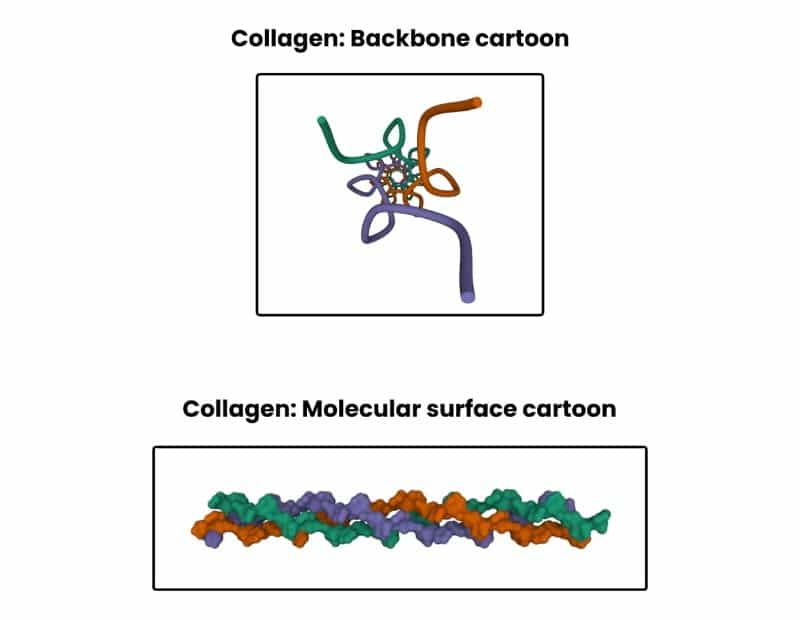
From a historical perspective, protein crystallography has provided transformative structures. Examples include DNA, the ribosome, hemoglobin, insulin, collagen, kinesin, and G-protein-coupled receptors, to name just a few.
Check out Figure 2 below to see the triple helix structure of collagen.
Furthermore, it’s guaranteed to remain fundamental in emergent fields like epigenetics and structural genomics. Structural insights on the packaging of genetic material and changes to its structure in response to physiological and environmental triggers are bound to have profound implications.
Meanwhile, there are frontiers in protein crystallography that, if overcome, would have an immediate positive impact.
A good example is the savagely hard task of solving membrane protein structures using protein crystallography.
Membrane proteins are key drug targets, yet there is an extreme scarcity of membrane protein structures because they are difficult to purify and crystallize.
Meanwhile, advances in sources of X-rays are enabling researchers to collect data from smaller, poorer-quality samples. X-ray free-electron lasers may, one day, allow us to collect diffraction patterns from single molecules! [4]
And one day, the constraint of needing a crystal of a sample to solve its structure will probably no longer exist. Electron microscopy is hastening that day, and structural science is richer for it.
A Summary of What is Protein Crystallography?
How do you summarize all that? It’s complicated! But we’ve taken a jargon-free look at protein crystallography, what it is, and what it can tell you.
We’ve explored how data resolution influences what observations can be made of a structure. And we’ve looked into the hurdles that make protein crystallography so attritional and expensive.
Note that this introduction has some extreme simplifications—but it was a short introduction after all.
Check out this article to see how X-ray crystallography compares cryo-EM and NMR. And get practical techniques for growing protein crystals! confused by protein structure files? You can learn more about protein structure files and how to unlock the information they contain.
References
- McPherson A and Gavira JA. (2014) Introduction to protein crystallization. Acta Crystallogr F Struct Biol Commun 70(Pt 1):2–20
- McCoy AJ et al. (2007) PHASER crystallographic software. J Appl Crystallogr 40(4):658–74
- Hendrickson WA. (2014) Anomalous diffraction in crystallographic phase evaluation. Q Rev Biophys 47(1):49–93
- Poudyal I, Schmidt M, and Schwander P. (2020) Single-particle imaging by x-ray free-electron lasers-How many snapshots are needed? Struct Dyn 7(2):024102
Further Reading
Glazer AM (2016) X-ray Crystallography: A Very Short Introduction, 1st Edition. Oxford University Press: Oxford
You made it to the end—nice work! If you’re the kind of scientist who likes figuring things out without wasting half a day on trial and error, you’ll love our newsletter. Get 3 quick reads a week, packed with hard-won lab wisdom. Join FREE here.


