
The central dogma of molecular biology cogently explains the one-directional flow of information from DNA into RNA, and RNA into a functional protein.
And what information carries more impact and functional relevance than an experimental structure?
Whatever you research, wherever your assay targets lie on the central dogma, and wherever your native host is on the tree of life—functional proteins are involved.
You may isolate RNA for your experiments and rarely conduct protein structure analysis. Or you may analyze proteins routinely as part of your omics project.
Choose a free resource to help you move forward
CHEAT SHEET
Western Blot Cheat Sheet
CHEAT SHEET
SDS-PAGE Protocol Cheat Sheet
Either way, information that could be crucial to forming a hypothesis or informing your experimental design, might be currently overlooked.
How so?
When we open a PDB file (a file that encodes the experimental structure of a macromolecule) in a molecular graphics program, a lot of information simply isn’t displayed!
So let me help you wring the most from the data that’s in your hands. Stay with me as we learn how to read PDB files and dig up beneficial data.
What Is a Protein Data Bank File?
Protein structures are information-rich entities.
We use them to understand and exploit, well, most life processes. Examples that spring straight to mind are antimicrobial resistance, the onset of disease, and treatment thereof.
Structural data for a protein is usually obtained via X-ray crystallography, cryo-electron microscopy, or NMR on an appropriate sample.
After data has been processed, we get a file containing the positions of all atoms in a structure.
This is called a PDB file, which stands for Protein Data Bank.
A PDB File is Just a Text File
Have you ever wondered why protein structures are so rich in information yet PDB files are so small? That’s because they’re just ASCII files that contain (a lot) of coordinate data for all of the constituent atoms.
They can, therefore, be opened in text editors such as Notepad.
Before we drill down into the extra structural information that’s available and put it in a biological context, let’s take a moment to familiarize ourselves with the basics of a PDB file.
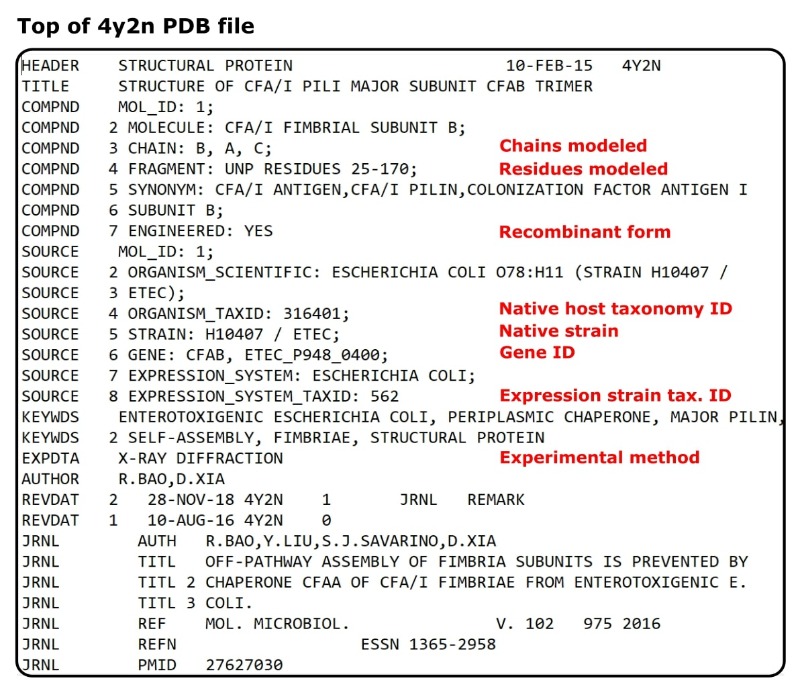
We’ll take a look at the PDB file for the major subunit of the colonization factor timer, CfaB, from Escherichia coli (PDB ID: 4y2n). [1]
Follow the link and notice the blue button in the top right of the page that reads “Download Files.” Click on it, then select “PDB Format.”
Navigate to where the file “4y2n.pdb” was downloaded. Right-click on it, place the cursor over “Open with”, and select “Notepad.”
What’s in a PDB file?
Well, you can get a ton of metadata (data about data) straight off the bat.
To return to our example, you should have a file open containing lots of information. But don’t worry; we’re going to keep things simple.
Two things to note here:
- The capitalized words on the far left-hand side are headers or “cards” that denote what the information on that row pertains to. (E.g., HEADER, TITLE, SOURCE.)
- The first chunk of data in any PDB file contains experimental metadata that describes, amongst other things, how the corresponding structure was solved.
Regarding point 1, the cards are the best way to navigate a PDB file.
Regarding point 2, there’s usually a wealth of handy information here. Using our example, we can immediately ascertain the host taxonomy ID, strain ID, and gene ID (all under the SOURCE cards).
And using the COMPND cards, we can glean that the structure corresponds to residues 25-170 of colonization factor I.
If you’re struggling to see where this information is, check out Figure 1 for a nudge in the right direction.
So, we have all of this useful information without trawling through a paper or its supporting info. Manually inspecting a PDB file can save you time as well as aid your protein structure analysis.
There’s a lot more information, though, and to go through it all is beyond the scope of this article. Still, take a look through and see what you can pick out.
Note also that not all PDB files contain the same types of metadata. Some are a lot less rich. This is because of the deposition age, software used in solving the structure, and the diligence of the depositors.
Get Useful Structural Data at a Glance
The metadata is useful, but the primary goal of this article is to describe some of the extra structural data that’s available to you to help you with your protein structure analysis.
So, let’s move on to a more relevant area of the PDB file and expand our understanding a little further.
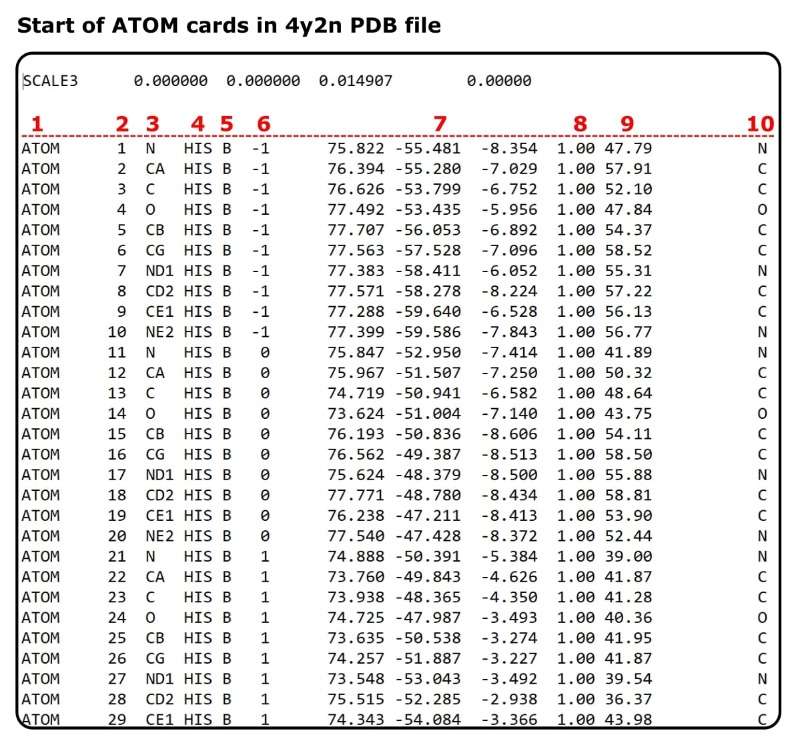
Scroll down to where the ATOM cards begin (see Figure 2).
What does the data in the ATOM cards mean?
That’s a good question, and the answer is necessary to understand the examples to come. It also gives you some of the required tools to judge the quality of a structure.
I’ll briefly explain them before giving some illustrated examples of how this data manifests in a biological context.
A Breakdown of the ATOM Card
Let’s just churn through this one by one and move on to the fun stuff. The subheader numbers correlate to the red numbers above each data column Figure 2.
1. The Card
As explained already, the cards signal the information that follows them. They have specific definitions because the programs that read PDB files to display and interrogate protein structures must categorize all the information.
So the cards enable software packages to “know” that, for example, this leucine belongs to chain A, this atom belongs to a ligand, these two atoms should not have a covalent bond between them, and so on.
If you’re still unsure, .ris citation files use tags in a similar way to enable software like Mendeley to generate formatted references.
2. Atom Number
There’s not much to say other than that every atom in a structure is assigned a unique number. That’s what this number corresponds to.
Remember, every protein is made up of a chain of amino acids, which in turn are made up of atoms. There are also atoms belonging to solvent and ligands that may also inhabit a protein structure. All of these require a unique digit to identify them.
3. Atom Type
These letters denote the atom type in a given residue. For example, “CA” is the alpha carbon, “CB” is the beta carbon, and “O” is the peptide carbonyl oxygen, and so on.
And if you need a quick refresher:
- The alpha carbon is that to which the side chain is bound;
- The beta carbon is the first atom in the side chain;
- So on, up the Greek alphabet as one gets further away from the alpha carbon.
We seldom think about “delta” or “epsilon” carbons, but they exist in larger residues.
4. Three-Letter Amino Acid Code
Something we’re all probably familiar with—amino acid codes. Here’s a table of the codes if you, like me, always forget the difference between glutamine and glutamic acid.
5. Chain ID
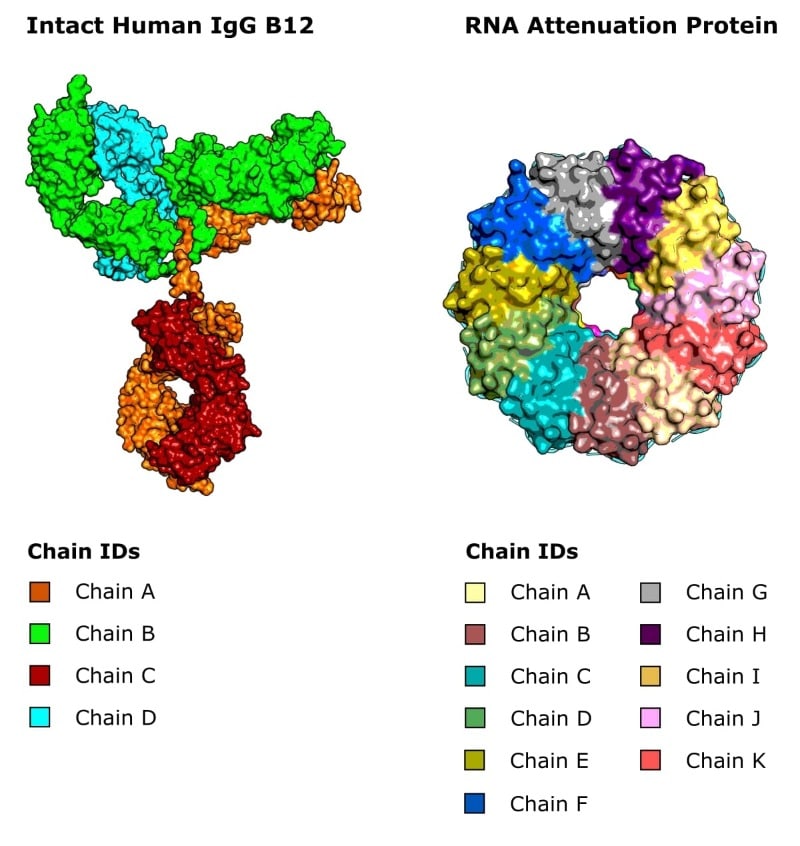
IgG antibodies comprise four discrete polypeptide chains held together by disulfide bonds.
Similarly, other proteins may function as dimers, or larger oligomers, that are also made up of two or more discrete polypeptide chains (Figure 3).
And in X-ray crystallography, protein molecules can clump together asymmetrically, and then this asymmetric unit can pack together symmetrically to form a crystal.
The point is we need a way to delineate polypeptide chains, and that’s what this label is.
6. Residue Number
Again nothing fancy here, just the number of the amino acid in a given polypeptide chain going from N- to C-termini.
A few points to bear in mind here:
Some structural biologists make it so the amino acid that takes residue number “1” is always the first amino acid in the protein sequence. Makes sense, right? Yes, it does, but:
- Any N-terminal affinity tags included in the structure take negative residue numbers (which is fine).
- Structures corresponding to incomplete proteins may have residue numbers that differ from their numerical position in the complete protein sequence.
Both of these are true for our example, CfaB. Notice how the first two His residues in chain B take numbers -1 and 0. So, only the last two residues in the (His)6 affinity tag were built.
And notice that, although the structure corresponds to CfaB residues 25-170, the residue numbers go 1-147. That’s because the solved structure corresponds to an incomplete protein sequence.
When viewing PDB files in the wild, you’ve got to have your wits about you.
7. Atom Coordinates
A PDB file displays a 3-dimensional structure on a 2-dimensional screen. So, all the atoms have a set of coordinates, XYZ, that describe their position relative to a single point of origin, 000.
8. Atom Occupancy
This number denotes the percentage of time that an atom exists in a single position within a structure.
Most of the time, the number is 1.0 (100%) because atoms usually occupy only one position. Simple enough.
However, sometimes the same atom might exhibit two or more discrete positions. Just not at the same time.
Huh?
Imagine the palm of your hand representing the aromatic ring on a tyrosine residue. Let’s say 80% of the time your fingers point upwards, and 20% of the time your fingers point sideward.
The tyrosine is waving.
In such a scenario, the occupancy of the atoms that belong to each conformation would be 0.8 and 0.2.
Imagine that your wrist is the alpha carbon. It doesn’t move as you wave, so its occupancy would be 1.0.
Structural scientists call such phenomenon “disorder,” and there are many sound reasons why it might occur in an experimental structure of a macromolecule or chemical, including:
- Competing sources of H-bonds that stabilize different conformations;
- Adoption of discrete but energetically similar conformations during crystallization;
- Ditto for electron microscopy grid preparation;
- A region of a molecule possessing no innate structure (e.g., loops);
- On rare occasions, atoms move between conformations during data collection.
In such cases, and if the experimental data allows, it’s better to build this part of the structure two (or more) times, with each one representing a plausible conformation suggested by the experimental data.
And the occupancy of these parts will sum to 1.0 because the molecule cannot magically duplicate a region—this is just something structural biologists do to provide a structure that best explains experimental data.
Three final points to note:
Scenario 1 in the list above leads directly to scenarios 2 and 3.
Ligands can exhibit disorder too. It can be a crucial consideration when optimizing lead compounds for drug discovery to leverage (for example) selectivity towards a particular organism.
Scenario 5 in the above list is quite rare because structural data are usually collected at cryogenic temperatures.
9. Atomic Displacement Parameter
They might look it, but protein structures aren’t static, and all the atoms jiggle a bit. Some atoms jiggle a lot.
And it’s the goal of a structural scientist to build a structure that describes the experimental data as accurately as possible. I.e., a structure that takes into account this jiggling.
What’s needed, therefore, is some parameter to describe this jiggling?—a jiggle factor.
Fortunately, there is such a thing, and it’s formally called the “B factor.” [4]
It’s also called the “atomic displacement parameter” and the “thermal displacement parameter”.
It describes the displacement of atoms from an equilibrium position, and it assumes this displacement is spherical.1
That means the magnitude of the displacement is assumed to be the same in all directions. Hence its other name, the “isotropic displacement parameter.”
There’s a simple equation to describe the B factor:
\(B=8\pi^{2}U^{2}\)
Where:
- B is the B factor for a given atom, in units Å2.
- U is the mean displacement of that atom from equilibrium, in units Å.
So, if we want to calculate for how much an atom is jiggling, we just rearrange for U:
\(U=\sqrt{\frac{B}{8\pi^{2}}}\)
Let’s take another look at our example, CfaB (Figure 2). We can see that the very first atom is a peptide N atom in a histidine residue. We can also see that it has a B factor of 47.79 Å2.
To calculate the mean displacement of this N atom from its equilibrium position, we do the sum:
\(U=\sqrt{\frac{47.79}{78.96}}=0.61Å\)
For reference, a peptide C-N bond is about 1.3 Å long. So it’s not jiggling much.
If the B factors for a group of atoms are sufficiently large, it might signify that this region exhibits disorder, which has already been described.
What counts as “sufficiently large”, I hear you ask?
Well, there’s no simple answer because structural science is complicated.
For the sake of simplicity, let’s just say that B factors of 25–80 Å2 for the structural resolution range of 1.5–3.5 Å are “good.” [5]
When B factors creep above ~ 78.96 Å2 (8\(\pi\)2), the corresponding U values begin to exceed 1.0 Å, which, in approximate terms, approaches the length of a typical covalent bond.
So, there are grounds to say that the corresponding atoms are disordered.
Of course, an atom might jiggle by less than 1.0 Å and still be disordered between discrete conformations. The quality of most protein structure datasets simply isn’t good enough to build the corresponding conformations with confidence, however. Ultimately, it’s a judgment call made by the person building the structure.
You with me?
10. Element
These letters simply correspond to the element of the atom in question without any additional ranking.
Right then, let’s give all this information some biological context with the help of some illustrated examples.
An Illustrated Example of Disorder in Relation to Occupancy
Let’s take a peek at the cysteine protease, LmCPB, from the parasite Leishmania mexicana (PDB ID: 6p4e). [6] This protein is essential for the parasite to establish the cutaneous form of leishmaniasis, which is a neglected tropical disease.
The structure contains LmCPB in complex with a covalent inhibitor that exhibits two discrete binding modes (Figure 4).
Structural scientists would call this “two-part disorder.”
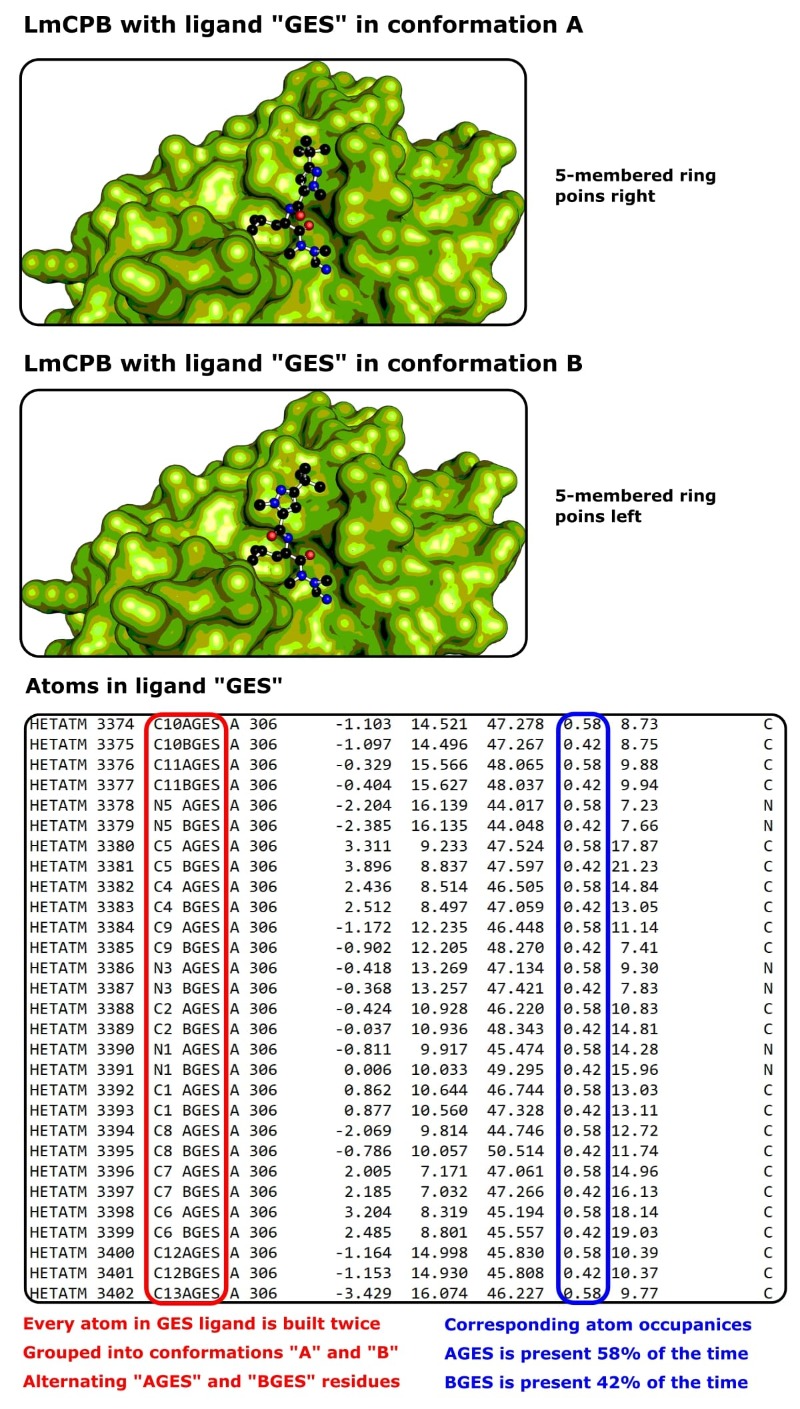
We can see from the PDB file that the atom occupancy of the inhibitor in each conformation is 0.42 and 0.58 (42% and 58%).
This tells us, despite each conformation being stabilized by different H-bonds, both conformations are similarly favorable.
If the occupancies were drastically different, it would suggest that the higher occupancy conformation is more stable. Thus, if we were optimizing this ligand, we might want to exaggerate features that help form this conformation.
Alternatively, residues that stabilize a given conformation might be present on homologs that we don’t wish to inhibit. In this case, we could use the structural data to modify the ligand to abolish said conformation.
An Illustrated Example of B Factors in Relation to Protein Function
Let’s now take a look at human aldose reductase (PDB ID: 1xgd). [7] It catalyzes the reduction of glucose in an NADPH-dependent manner.
We’ve already learned about B factors, but it’s also useful to know that protein structures can be represented graphically as “B factor putty.”
Similar to the cartoon representation, the protein molecule is represented as a ribbon (Figure 5). However, regions that have high B factors are shown as fat and red. Regions that have low B factors are narrow and blue. Intermediate B factors are yellow/green.
Both PyMOL™ and UCSF Chimera can render protein molecules this way.
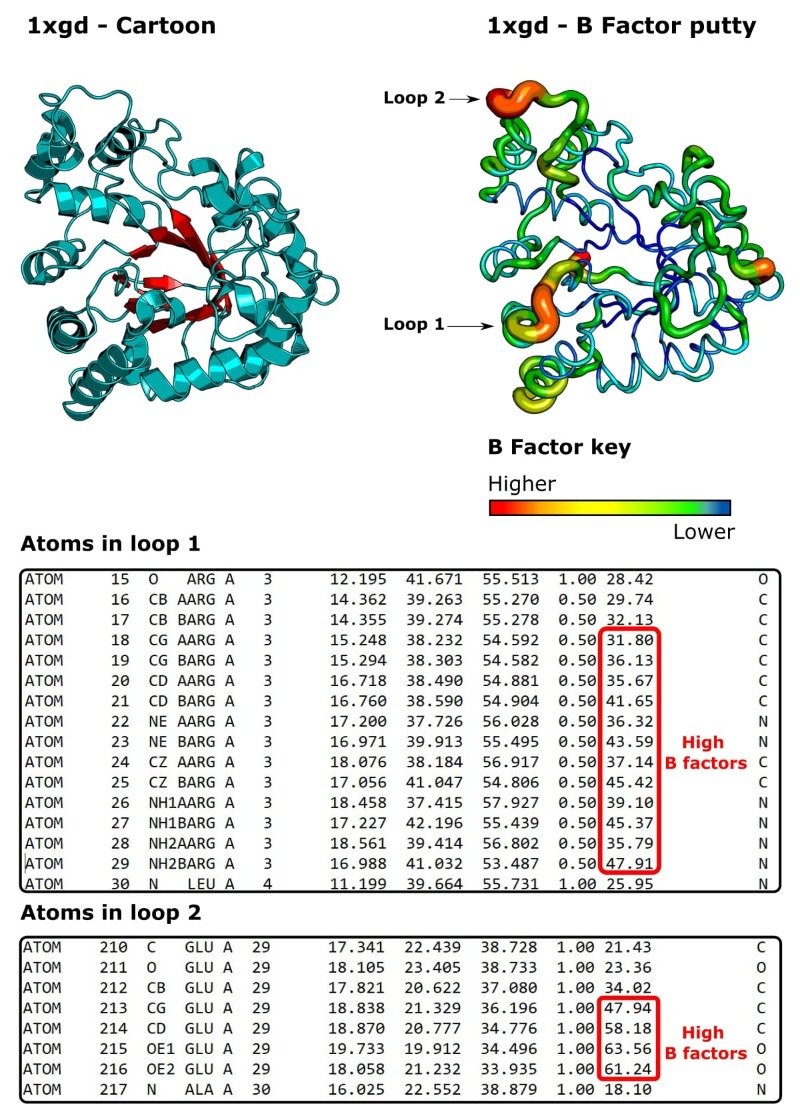
We can see that, generally speaking, this structure has low B factors, which means it’s nice and ordered, and that all copies of the protein molecule in the bulk crystal occupy almost identical conformations.
There are a few jiggly regions, though. Two of which I’ve circled and called “loop 1” and “loop 2.”
If we do a little research, it’s apparent that the residues in these loops are functionally important. [8]
In particular, kinetic data suggest that loop 2 undergoes a conformational rearrangement to bind to NADPH and release NADP+. [9,10]
In addition, the residues in loop 1 also move to form contacts with NADP+.
So, atomic B factors are clearly related to protein function in this example.
In fact, we can see from the occupancy values that each atom in loop 1 has been built twice with an occupancy value of 0.5.2
So, the loop has been built twice, going in two different directions (two conformations), and each set of “half atoms” belongs to one of the conformations.
Building it twice would result in lower B factors than if the loop was built once at an occupancy value of 1.0.
There are a few other properties to note from this example too.
We can see that the core of the protein has relatively low B factors. Any ideas as to why this might be so?
You guessed it. Because the core is buried, it doesn’t jiggle. It’s held in place by a network of H-bonds to itself and other regions of the molecule.
Conversely, while perfectly satisfactory, we can see that the edges of the molecule have slightly higher B factors than the core. This is because these regions are held in place by fewer H-bonds and are slightly more flexible.
Please note just because a region has high B factors doesn’t mean it is functionally important. The B factors may point you in the right direction, however.
Similarly, low B factors might indicate functional relevance.
The point is B factors are extra data to consider with your additional evidence when proposing a hypothesis or drawing a conclusion.
Protein Structure Analysis for You and Me
So, there we have it: a breakdown of the basic syntax of a PDB file, a glimpse at some useful metadata they contain, and a closer look at some structural data too.
Hopefully, this article helps you out the next time you do protein structure analysis or otherwise interrogate a macromolecule.
Have you got any questions? Need any topic expanding? Simply flummoxed? Let me know in the comments section below!
Footnotes
1Due to the particulars of structure solution by X-ray diffraction and cryo-electron microscopy, B factors are not uniquely determined by the movement of atoms in a molecule. The quality of the experimental data also influences it.
2Structural scientists can overtly set the occupancy of atoms, or you can let the occupancy change freely to settle on a value that best matches the experimental data.
References
- Bao R et al. (2016) Off-pathway assembly of fimbria subunits is prevented by chaperone CfaA of CFA/I fimbriae from enterotoxigenic E. coli. Mol Microbiol 102:975–91
- Saphire OL et al. (2001) Crystal Structure of a Neutralizing Human IgG Against HIV-1: A Template for Vaccine Design. Science 293:1155–59
- Antson A, Dodson E, and Dodson G et al. (199) Structure of the trp RNA-binding attenuation protein, TRAP, bound to RNA. Nature 401:235–42
- Sun Z et al. (2019) Utility of B-Factors in Protein Science: Interpreting Rigidity, Flexibility, and Internal Motion and Engineering Thermostability. Chem Rev 119:1626–65
- Carugo O. (2018) How large B-factors can be in protein crystal structures. BMC Bioinform 19:61
- Ribeiro J et al. (2020) Crystal structure of Leishmania mexicana cysteine protease B in complex with a high-affinity azadipeptide nitrile inhibitor. Bioorg Med Chem 28:115743
- Bohren KM et al. (2005) The structure of Apo R268A human aldose reductase: hinges and latches that control the kinetic mechanism. Biochim Biophys Acta 1748:201–12
- Balendiran GK et al. (2014) B-factor Analysis and Conformational Rearrangement of Aldose Reductase. Curr proteomics 11:151–60
- Kubiseski TJ et al. (1992) Studies on pig muscle aldose reductase. Kinetic mechanism and evidence for a slow conformational change upon coenzyme binding. J Biol Chem 267:6510–7
- Wilson DK et al. (1992) An unlikely sugar substrate site in the 1. 65 Å structure of the human aldose reductase holoenzyme implicated in diabetic complications. Science 257:81–4
You made it to the end—nice work! If you’re the kind of scientist who likes figuring things out without wasting half a day on trial and error, you’ll love our newsletter. Get 3 quick reads a week, packed with hard-won lab wisdom. Join FREE here.


