
Propelled into the scientific mainstream, cryo-electron microscopy (cryo-EM) and three scientists critical to its development won the Nobel Prize in Chemistry in 2017.
But what is cryo-electron microscopy? Why is the cryogenic aspect important? And how did it seemingly go from nothing to the big time?
Simple answers: it’s an ultra-high resolution imaging technique performed at cold temperatures that can provide atomic structures of complex biological samples such as viruses.
Let’s go a bit deeper than this, however. Read on for a crash course in cryo-EM.
Put this article into practice
Choose a free resource to help you move forward

POSTER
Immunofluorescence Troubleshooting Guide

POSTER
Fluorescent Proteins Guide
Sub Techniques Within Cryo-Electron Microscopy
There are several sub-techniques within cryo-EM. These are:
- Scanning electron cryomicroscopy (cryo-SEM).
- Cryo-correlative light and electron microscopy (cryo-CLEM).
- Cryo-electron tomography (cryo-ET).
- Transmission electron cryomicroscopy (cryo-TEM).
And check out Figure 1 below for a comparison of TEM and SEM microscopes.
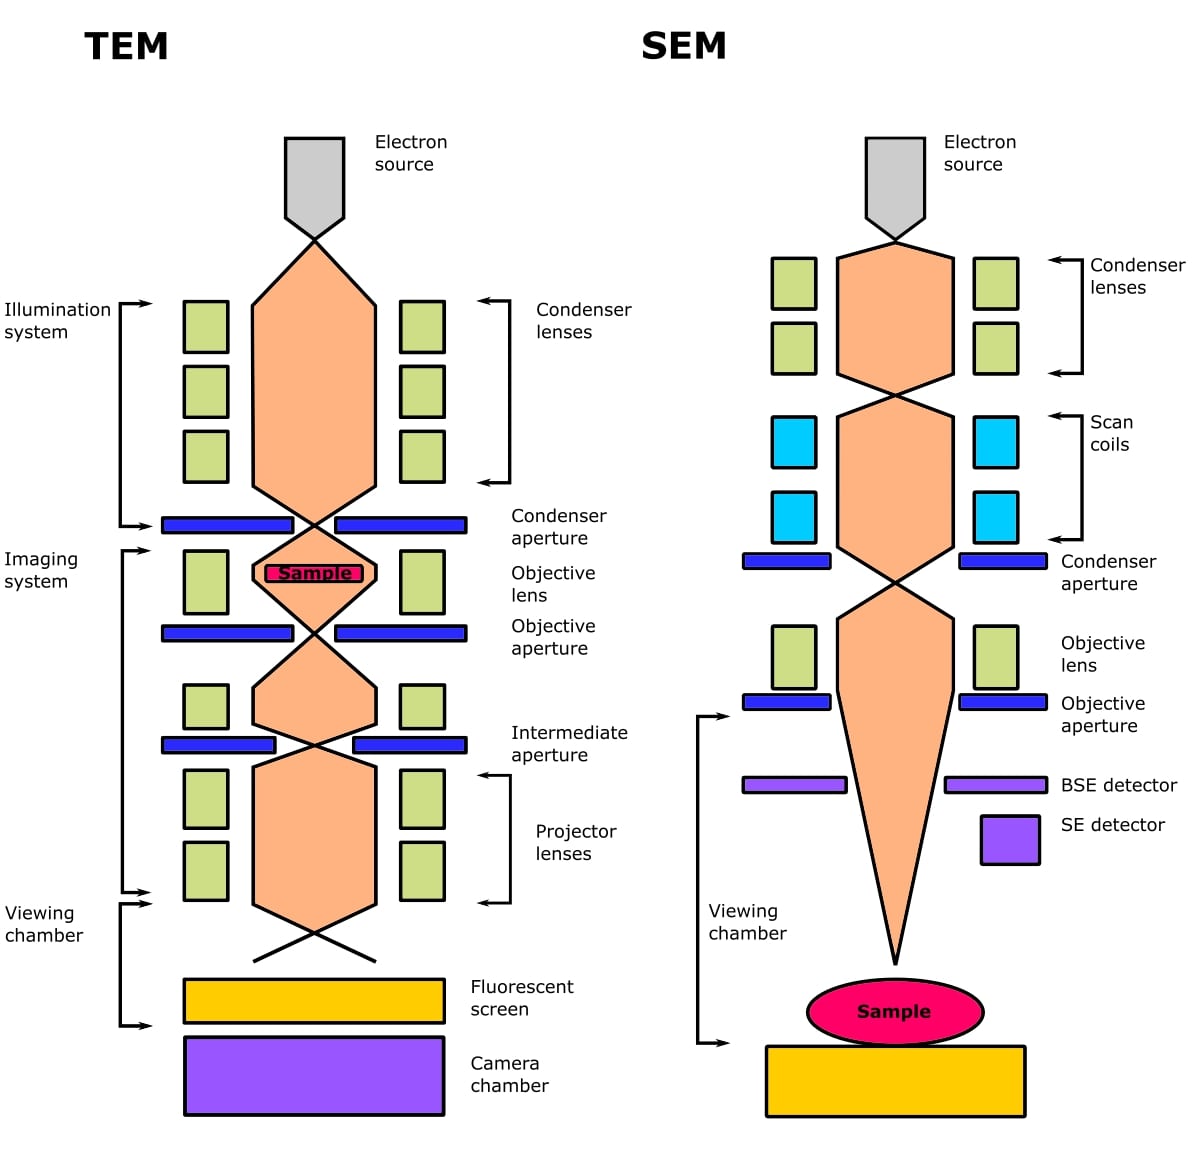
Techniques 1-3 are comparatively niche, and when people discuss cryo-EM, they invariably mean 4—transmission electron cryomicroscopy.
So, that’s what this article focuses on.
For simplicity, cryo-electron microscopy and its abbreviation are taken to mean cryo-TEM unless indicated otherwise from here on in.
What Is Cryo-Electron Microscopy?
Cryo-EM is transmission electron microscopy performed on samples maintained at cryogenic temperatures.
The cryogenic temperatures enable the near atomic-resolution structure determination of biomolecules in solution. This includes viruses, organelles, tissues, and proteins. [1]
A cryogenic temperature is simply anything below -150 °C. In cryo-EM, liquid ethane is used to cool samples to -188 °C.
Samples must be kept thin. Very thin. With cryo-EM, the goal is to image potentially hundreds of thousands of single particles and combine them into orientational classes. (Hold this thought.)
So for plenty of excellent reasons, the ideal sample thickness is the maximum sample particle dimension. A typical particle might have dimensions of 10-100 nm (100-1000 Å).
And speaking of samples, unlike X-ray crystallography, cryo-EM doesn’t require crystalline samples. This enables high-resolution structural data to be collected for specimens that are impossible to crystallize, including filaments, tissues, and some organelles.
Removing the requirement for crystallization also makes it possible to study samples that are extremely difficult to crystallize. Examples include membrane proteins, large protein complexes, ribosomes, and viruses.
Consequently, cryo-EM has expanded the range of material for which it’s possible to collect structural data and emerged as a parallel technique to X-ray crystallography. This ultimately means more data for everyone.
Answering Your Questions Early On
I anticipate the last section might have raised a few questions already. In the interest of clarity later, let’s clear these up straight away.
Why Is Liquid Ethane Used?
The “cryo” aspect of cryo-EM confers three main benefits:
- Radiation damage of the sample caused by the electrons is reduced.
- Samples are protected from the harsh vacuum in the microscope.
- Water molecules are locked in place around native samples.
Point 3 is the critical one here. You see, although cryo-EM is technically a solution-state technique, it’s performed on frozen samples.
Eh?
The word “frozen” is a misnomer, and we shouldn’t use it when describing cryo-EM samples.
The correct word is vitrified. Cryo-EM samples are vitrified.
That’s to say; they are cooled well below the freezing temperature of the water too quickly for the water molecules to rearrange into ice crystals. Because ice crystals are less dense than water, and because they are sharp, they would rupture and denature biological samples upon formation. So, although cryo-EM samples are cooled to the extent of forming a solid, this solid is a literal snapshot of the individual molecules as they were oriented in solution.
(As an aside, this is why we add glycerol to competent cells. Glycerol disrupts the H-bond network of water molecules to prevent the formation of lethal ice crystals.)
What’s Wrong with Liquid Nitrogen?
Well, it’s not that it isn’t cold enough. At -196 °C, it’s a bit cooler than liquid ethane. In fact, liquid nitrogen is used to keep the liquid ethane cold!
One problem lies with its heat capacity.
Heat capacity is simply the amount of heat energy a material can absorb to produce a given change in temperature.
The heat capacity of liquid nitrogen is too low to successfully vitrify cryo-EM samples. Upon plunging into liquid nitrogen, some of the latter boils as it absorbs heat from the much warmer sample. This slows the cooling process down such that ice crystals can form, destroying the sample.
Liquid ethane has a higher heat capacity than liquid nitrogen. It doesn’t boil when the sample is plunged into it, so the cooling process is quicker, allowing for pure vitrification.
Another problem lies with the tendency for liquid nitrogen to create a layer of cold gas above the liquid nitrogen surface. This can cause sample precooling as it is dipped towards liquid nitrogen, which leads to ice formation. [2]
And since we’re already on a bit of a tangent, let’s address a corollary. Readers who have lyophilized plasmid DNA may be thinking: “hang on, doesn’t water sublime in a vacuum?”
Yes, it does! But most freeze dryers operate around -60 °C. If you go much colder, the physical impetus for sublimation becomes negligible. This is why ice moons can exist for eons in the vacuum of space.
And remember: sublimation is when a substance transforms from a solid to gas without ever becoming a liquid. Moving on.
Why Are Thin Samples so Important?
Let’s not get into single-particle image reconstruction here because the theory and instrumentation are so advanced that they border on magic.
Samples that are too thick for purpose causes:
- Molecules lying at different focal heights of the microscope.
- Scattering of incident electrons by the vitrified water.
Both of which lower the signal-to-noise ratio, which tarnishes the magic. [3]
Regarding point 1, it’s important to remember that cryo-EM structures comprise data collected from at least tens of thousands of individual yet identical particles.
Regarding point 2, it’s important to remember that the sample molecules scatter incident electrons, which are refocused by a series of lenses to produce an electron micrograph. Electrons scattered by the vitrified water encode no beneficial information about the sample.
What Are the Size and Resolution Limits of Cryo-Electron Microscopy?
There are no hard limits.
That’s not quite the complete picture, however. Let’s take a moment to consider the sample size and resolution limits in X-ray crystallography.
- The upper size limit is anything that will crystallize.
- There’s no lower limit since small molecules crystallize better than big ones.
- The resolution limit is the radiation wavelength, λ, divided by 2.
There are a few exceptions, such as detergents and polymers, which are recalcitrant to crystallization. However, it’s fair to say these are definite rules.
Not so for cryo-EM. In summary:
- There’s no theoretical upper size limit.
- The lower size limit is 52 kDa at present. [4]
- The resolution limit is 1.22 Å at present. [5]
However, these values are likely to change as this article ages as the limits aren’t as clear-cut as in X-ray crystallography. Let me elaborate.
The upper size limit of cryo-EM isn’t really discussed in the scientific literature. It’s generally assumed the sample size limit is anything you can purify, be bothered to solve, or can afford the computing power for.
Thus, it’s been used to solve the structure of the dengue virus, which weighs about 11 MDa. [6] Big enough.
The lower size limit, however, is a hot topic. At the time of writing, the smallest structure solved using cryo-EM is streptavidin, which weighs 52 kDa. [4] The average molecular mass of a bacterial protein is 40-50 kDa depending on species and genus. So it’s reasonably clear why there is a massive effort to reduce this lower limit.
Incidentally, the predicted theoretical lower limit of cryo-EM is 38 kDa. The reasons are much too complicated to get into but have to do with the difficulty in obtaining high-quality information from non-crystalline material. You can read about it here if you fancy a deep dive. [7]
Similarly, the resolution limit is also influenced by several complicating factors. These include beam-induced movement of the samples during imaging, sample damage during vitrification, sample damage during imaging, and suboptimal exposure times. As yet, the highest resolution structure solved using cryo-EM is apoferritin, at 1.22 Å. [5]
Cryo-Electron Microscopy vs. X-ray Crystallography
Let’s compare and contrast high-resolution biomolecular imaging techniques.
We’ve already touched on a few differences between cryo-EM and X-ray crystallography. One difference we’ve not discussed is how the samples in these techniques are illuminated, which is fundamental.
In a cryo-EM experiment, electrons are scattered when they hit the sample.
Electrons are negatively charged. This charge can be exploited to focus the scattered electrons electromagnetically in real-time to produce an image (the micrograph).
Our eyes do a similar thing with photons of visible light. While these quanta don’t have a charge, their wavelength is long enough (~ 400-700 nm) to interact with and be focussed by optical lenses.
The wavelength of a 200 keV electron such as those produced in a TEM microscope is ~ 2.7 pm. This is about 150,000 times shorter than the wavelength of visible light and is too small to be focused using an optical lens. Hence the need for electromagnetic lenses.
X-rays are the worst of both worlds. Their wavelength, about 1 Å in an X-ray diffraction experiment, is too small to interact with an optical lens—they would just pass straight through it.
Recall 1 nm = 10 Å = 1000 pm.
Nor are X-rays charged, so they cannot be focussed using electromagnetic lenses. They are a terrible way to illuminate a sample, really.
Consequently, X-rays scattered by crystalline samples in an X-ray diffraction experiment must be focussed mathematically and at a later point in time.
Unfortunately, this causes crucial data to be lost. In fact, it’s much worse than that. All data that contributes the most to the final electron density map is lost. Ouch!
This is called the phase problem. It’s not insurmountable, but we never get the data back. Instead, it must be estimated by a complex process of inspired trial-and-error and other clever methods. [8]
This leads to its own problems, not least among which is an incredible bias towards the model built into the electron density maps appearing to be statistically and visually correct regardless of whether it is.
Sounds scary because it is! It has led to structures published that were later discovered to be completely incorrect. [9,10]
Cryo-EM, because the refocussing of the scattered electrons is done in real-time using physical lenses, doesn’t suffer from this. There’s no phase problem. It does suffer from its own biases, and we’ll get to those, but they are less pernicious.
Cryo-Electron Microscopy vs. NMR
And what about NMR? We’ve not spoken about that yet.
Well, it doesn’t rely on radiation to illuminate samples, so it too is free from the phase problem. Instead, it measures how atomic nuclei align themselves in a pulsed magnetic field.
This is great because it requires a genuine solution-state sample, not crystals or vitrified ones. So, short of in-cell imaging, NMR samples are the most representative of the native state.
However, NMR spectra get noisy very quickly. Data from those thousands of nuclei aren’t spatially resolved like in a micrograph or diffraction pattern. Consequently, protein NMR spectra are complicated and hard to deconvolute.
This means that except for highly specialist applications, the upper sample size limit for protein NMR is approximately 35 kDa. [11] This obviously rules out most protein···protein complexes and any large complex, really.
That’s a lot of information. Let’s summarize the comparison between the techniques Table1 below.
Cryo-electron microscopy | X-ray crystallography | NMR |
Uses electrons to illuminate samples | Uses X-rays to illuminate samples | Uses magnetism to produce spectra of sample nuclei |
Electrons are ionizing radiation | X-rays are ionizing radiation | Magnetism is non-ionizing |
Vitrified-state samples | Crystalline-state samples | Solution-state samples |
Used to solve 5.51 % of structures in the protein data bank | Used to solve 87.1 % of structures in the protein data bank | Used to solve 7.24 % of structures in the protein data bank |
Theoretical lower sample size limit: 36 kDa | No lower sample size limit | No lower sample size limit |
No theoretical upper sample size limit | Upper sample size limited by crystallizability | Upper sample size limit: ~ 35 kDa |
Potential Issues: The Future of Cryo-Electron Microscopy
Despite prohibitively limited access to suitable microscopes such as the Titan Krios, cryo-EM is transforming the fields of molecular and structural biology. That’s clear from everything we’ve discussed in this introduction and from a quick browse of the EMDB.
But there are two things we need to address.
Bias in Cryo-Electron Microscopy
Earlier on, I asked you to hold a thought regarding classifying particles. I also mentioned that cryo-EM structures suffer from bias. These are cardinal points because they represent a significant problem with cryo-EM that needs to be addressed.
Particles on electron micrographs lie in all manner of orientations. These orientations must be divided into classes. Then, each particle that is to be included in the analysis is assigned to a class. Simple. [12]
This can lead to bias. [13] Particularly so when the assignment is manual. But it also occurs when the process is automated because a human wrote the program, although deep learning algorithms may ameliorate this.
A concerning consequence of this is that researchers may end up with an electron density map that contains features that aren’t in their sample. From there, it’s a slippery slope to drawing incorrect conclusions.
One solution is to split, at random, all of the particles analyzed into two sets. Then build two electron density maps and see how well they compare. [14] Great! But this only provides a measure of internal consistency.
Estimating absolute correctness is difficult. Remember the phase problem in X-ray crystallography? I probably under-sold it, but it’s so problematic and so surreptitiously pushes crystallographers towards building incorrect models that they have come up with a solution.
It’s called the free R factor. [15] Basically, a chunk of diffraction data (usually 5–10%) is omitted entirely from the process of constructing an electron density map. It’s not used at all. Then, as you build a model into the electron density, you periodically perform a computational diffraction experiment on it. If the model is genuinely correct, it should agree with the diffraction data not used to build it.
Cryo-EM urgently needs an equivalent metric. The problem is, it’s just not that easy to come up with one.
At the moment, all the nominated particles are needed to construct the electron density maps. You can’t afford to just bin 10% of them. And even if you could back-compute a micrograph from your atomic model, how do you account for all the different particle orientations? And how much confidence would you have given that micrographs are so noisy?
Okay, you can back-compute just an electron density map from your suggested model, then pick particles on your micrograph that resemble it to derive subsequent electron density maps from. But, well-intentioned as that may be, it just leads to more bias.
Overestimating Resolution in Cryo-Electron Microscopy
And the other issue. Resolution. Earlier, I quoted the highest resolution structure solved using cryo-EM to date, apoferritin, to one-hundredth of angstrom. That’s one picometer. I did this deliberately to illustrate this point: is any solved structure accurate to one picometer?
The answer is no. This is because an experimental structure of a single molecule doesn’t even have a uniform resolution across itself. Particularly in cryo-EM, where anisotropic (non-uniform) resolution is part and parcel of the structures solved using it. [16]
The problem is that we rely too much on the resolution as the ultimate metric to judge structures. And I have been adding to the problem. Throughout this introduction, I’ve highlighted resolution plenty of times when comparing cryo-EM to its counterparts. I haven’t spoken about any other metrics.
Just to be clear, over-reliance on the purported resolution isn’t a problem caused by the emergence of cryo-EM. It goes deeper than that. Although, it is fair to say that cryo-EM is a revolutionary technique at the center stage of structural biology. As such, it’s an opportunity to change old habits.
The mere uptake of cryo-EM is already a feat of behavior change among scientists who, let’s face it, can be very set in their ways. Another one must be possible.
Holler Back!
What is cryo-electron microscopy? I’ve hopefully given you a cerebral yet informative answer.
And while I’ve dabbled in cryo-EM, I’m not, in any sense of the word, a microscopist. I am sure a lot of you are, however. So please add anything relevant or simply put me right in the comments section below! Shout out too if you have found this introduction helpful.
References
- Dillard RS, Hampton CM, and Strauss JD et al. (2018) biological applications at the cutting edge of cryo-electron microscopy. Microsc Microanal 24:406–19
- Engstrom T et al. High-resolution single-particle cryo-EM of samples vitrified in boiling nitrogen. IUCrJ 8:867–877
- Glaeser RM et al. (2016) Factors that Influence the formation and stability of thin, cryo-EM specimens. Biophys J 110:749–55
- Liu Y, Huynh D, and Yeates TO (2019) A 3.8 Å resolution cryo-EM structure of a small protein bound to an imaging scaffold. Nat Commun 10:1864
- Nakane T, Kotecha A, and Sente A et al. (2020) Single-particle cryo-EM at atomic resolution. Nature 587:152–6
- Zhang X, Ge P, and Yu X et al. (2013) Cryo-EM structure of the mature dengue virus at 3.5-Å resolution. Nat Struct Mol Biol 20:105–10
- Henderson R (1995) The potential and limitations of neutrons, electrons and X-rays for atomic resolution microscopy of unstained biological molecules. Q Rev Biophys 28:171–93
- Taylor GL (2010) Introduction to phasing. Acta Crystallogr D Biol Crystallogr 66(Pt 4):325–38
- Wlodawer A, Dauter Z, and Porebski PJ et al. (2018) Detect, correct, retract: How to manage incorrect structural models. FEBS J 285:44466
- Hodel A, Kim S-H, and Brünger AT (1992) Model bias in macromolecular crystal structures. Acta Cryst A48:851–58
- Hongtao Y (1999) Extending the size limit of protein nuclear magnetic resonance. PNAS 96:332–34
- Serna M (2019) Hands on methods for high resolution cryo-electron mMicroscopy structures of heterogeneous macromolecular complexes. Front Mol Biosci 6:33
- Henderson R (2013) Avoiding the pitfalls of single particle cryo-electron microscopy: Einstein from noise. PNAS 110:18037–41
- Monya B (2018) Cryo-electron microscopy shapes up. Nature 561:565–67
- Brünger A (1992) Free R value: a novel statistical quantity for assessing the accuracy of crystal structures. Nature 355:472–5
- Vilas JL, Tagare HD, and Vargas J et al. (2020) Measuring local-directional resolution and local anisotropy in cryo-EM maps. Nat Commun 11:55
You made it to the end—nice work! If you’re the kind of scientist who likes figuring things out without wasting half a day on trial and error, you’ll love our newsletter. Get 3 quick reads a week, packed with hard-won lab wisdom. Join FREE here.

Put this article into practice
Choose a free resource to help you move forward
POSTER
Immunofluorescence Troubleshooting Guide
POSTER
Fluorescent Proteins Guide


