
Rubbish in, rubbish out.
We all know that scientific instruments aren’t magic and can give you data that are only as good as your sample. Often enough in molecular biology, we ask ourselves: well, how good is my sample? Did I perform my assay poorly, or did I feed my assay rubbish?
Insofar as protein samples are concerned, we can answer these questions with a technique called circular dichroism.
This article will take you through the basic principles of circular dichroism and the practical aspects and sample preparation using a real-life example.
Choose a free resource to help you move forward
EBOOK
Free Guide to Protein Expression
DOWNLOAD
Western Blot Troubleshooting Card
What Is Circular Dichroism and What Are Its Applications?
Circular dichroism (CD) is a type of spectroscopy that can tell you the type and percentage of secondary structure units in a protein sample.
After a successful CD experiment, you’ll have the answer to these questions:
- Is my protein sample folded?
- What percentages of alpha-helix, beta-sheet, and random coil are in my protein sample?
And because most modern CD spectrometers have variable temperature sample cells:
- How does the secondary structure of my protein sample change with temperature?
- What is the melting point, Tm, of my protein sample?
Granted, answering these questions isn’t going to win you a Nobel Prize because they are quite basic. But it’s the frequency with which they occur that makes them worth addressing.
And perhaps question 1 is so basic, you forget to ask it when things aren’t going right!
For example, you’ve purified a recombinant protein and used it in a series of binding assays. These binding assays have returned a negative result. Do you accept this negative result without knowing if your protein sample is folded?
Let’s instead say that your assays returned a positive result. So, to enrich your data, you’ve mutated a few pertinent residues. Have these mutations altered the structure of your sample? Are you getting these results because of a change in protein structure?
Perhaps you’re farming protein out to give to a collaborator. It’d be a bit of a faux pas to realize way down the line that you’d been providing them with misfolded junk. Better to check that now.
Maybe you’ve attempted to refold your protein and need to check whether or not you’ve been successful.
Or, to give a more particular example, perhaps you’re interested in how the structure of a protein changes to recognize a binding partner. Well, mix them together in a CD spectrometer. It’s way simpler than solving the structure of the complex via crystallography.
An Example Use Case
Still not sold?
At first glance, the above four questions probably sound easy to answer by other methods that are already in your repertoire. Consider the following case, however:
“I work on the novel protease ____. I have purified a recombinant version of ____ and got a band on SDS-PAGE. My gel filtration chromatogram looks dodgy, though, and is far from Gaussian. Also, my activity assay results are garbage. My dream goal is to solve the structure of ____ and implicate it in dreadful disease X.”
Most of us who do our research at the in vitro side of life science have been there.
And if you are unfortunate enough to work on a membrane protein, you probably don’t even have an activity assay. Garbage results are a wistful dream.
So, how much time and energy do you want to invest in pursuing these research goals when you can’t even be sure your sample is folded?
This is where CD comes into the picture. [1] It’s your label-free, substrate-free window into whether or not your purified protein is folded and a starting point from which to begin troubleshooting when things aren’t going to plan.
Pros and Cons of Circular Dichroism
Before we dive into the technical aspects of CD theory, let’s present a quick summary of its pros and cons so you can decide whether CD really is for you (Table 1).
Table 1. The pros and cons of circular dichroism.
| Pros | Cons |
| Label-free | Low throughput |
| Non-destructive (unless you’re heating your sample) | You may not have easy access to a CD spectrometer |
| Solution-state measurements | You may need training or somebody to run your sample for you—there’s an extremely brief crash course here? |
| Good sample economy. Although this depends, of course, on your particular sample and its quirks | Accurate determination of sample concentration is needed for an accurate breakdown of secondary structure percentage |
The Principle of Circular Dichroism
I hate to break it to you, but CD theory is fundamentally biophysics. It relies on the unusual concept of circularly polarized light and can be a bit hard to wrap your head around.
Essentially, it exploits the unequal absorption of clockwise and anticlockwise circularly polarized light by chiral protein molecules to answer the questions posed above.
Remember, all protein molecules are chiral because the alpha carbon of every constituent amino acid is chiral, except for glycine.
Forgotten what a chiral molecule is? It’s a molecule that cannot be superposed onto its mirror image, just like your hands and feet.
To fully appreciate CD theory and become better scientists, we need to go a bit deeper than this, so that’s what we’ll do.
Stick with me if you don’t fully understand it because I’ll provide a link to a brief video to explain the concept shortly.
A Refresher on How Electromagnetic Waves Move
We’ve all read the textbooks and know that we model electromagnetic photons moving through space as a wave.
The mathematical function that describes these waves is a sine function—the waves are sinusoidal.
If your memory is a bit fuzzy, don’t worry. The four basic properties of photons that we need to appreciate to understand the basis of the CD method are:
- They move (propagate) in a straight line.
- They have an oscillating electric field (labeled E).
- They have an oscillating magnetic field (labeled B).
- The direction of the photon, the electric field, and the magnetic field are all mutually at 90° to each other.
Think of it this way: when a single photon moves directly towards you, head-on, the electric field oscillates vertically up and down, and the magnetic field oscillates horizontally left and right.
When we draw a wave on paper as a sinusoid, the line we draw (the sinusoid) represents the oscillating electric field. The magnetic field is there (it would oscillate in and out of the page), but we just don’t draw it.
Light Polarization and Linearly Polarized Light
Let’s have a think about construction. Take buildings, for example. They are constructed vertically because that’s the most sensible way to do it.
The electric fields of all the photons that are whizzing around us are not all vertical, however. They are not even roughly co-aligned. They are all randomly orientated.
And in many scientific (and recreational) applications, most of these random orientations aren’t useful, so we need to filter them out. In doing so, we leave just photons whose electric field is oscillating up and down, or for that matter, any single plane.
Accept for now that photons can be filtered this way to generate linearly polarized light.
Circularly Polarized Light
“How on earth do you generate circularly polarized light?” I hear you ask. Good question.
We start with linearly polarized light (I’d never waste your time) and then shift its magnetic field one-quarter wavelength backward relative to its electric field.
If this is done, the electric field ends up spiraling around the direction of propagation of the light wave in, yep, a circle. This is called circularly polarized light.
Remember that video I mentioned? It’s here. Imagine the red wave is the electric field, and the blue wave is the magnetic field.
And finally, we can generate circularly polarized light that spirals either clockwise or anticlockwise by shifting the magnetic field forward or backward one-quarter wavelength relative to the electric field.
The Circular Dichroism Experiment
Owing to the unique arrangement of chiral centers in any protein, they will absorb clockwise circularly polarized light better than the anticlockwise light, or vice versa, at any given wavelength.
A CD experiment measures the extent to which the clockwise and anticlockwise circularly polarized light is unequally absorbed by your protein sample after it’s been shone with equal amounts of both.
Here’s the key point—when unequal proportions of clockwise and anticlockwise circularly polarized light are added together, they combine to form a single wave that propagates as an ellipse.
So, because of the unequal absorption of circularly polarized light by chiral protein molecules, and because a CD experiment measures the light that passes from your sample to the detector, a CD experiment measures elliptical light.
And the ellipticity of the light is diagnostic of protein secondary structure. That’s the essence of CD theory.
We’ll illustrate this with a few examples in part 2, but for now, let’s expand on elliptically polarized light with some handy figures.
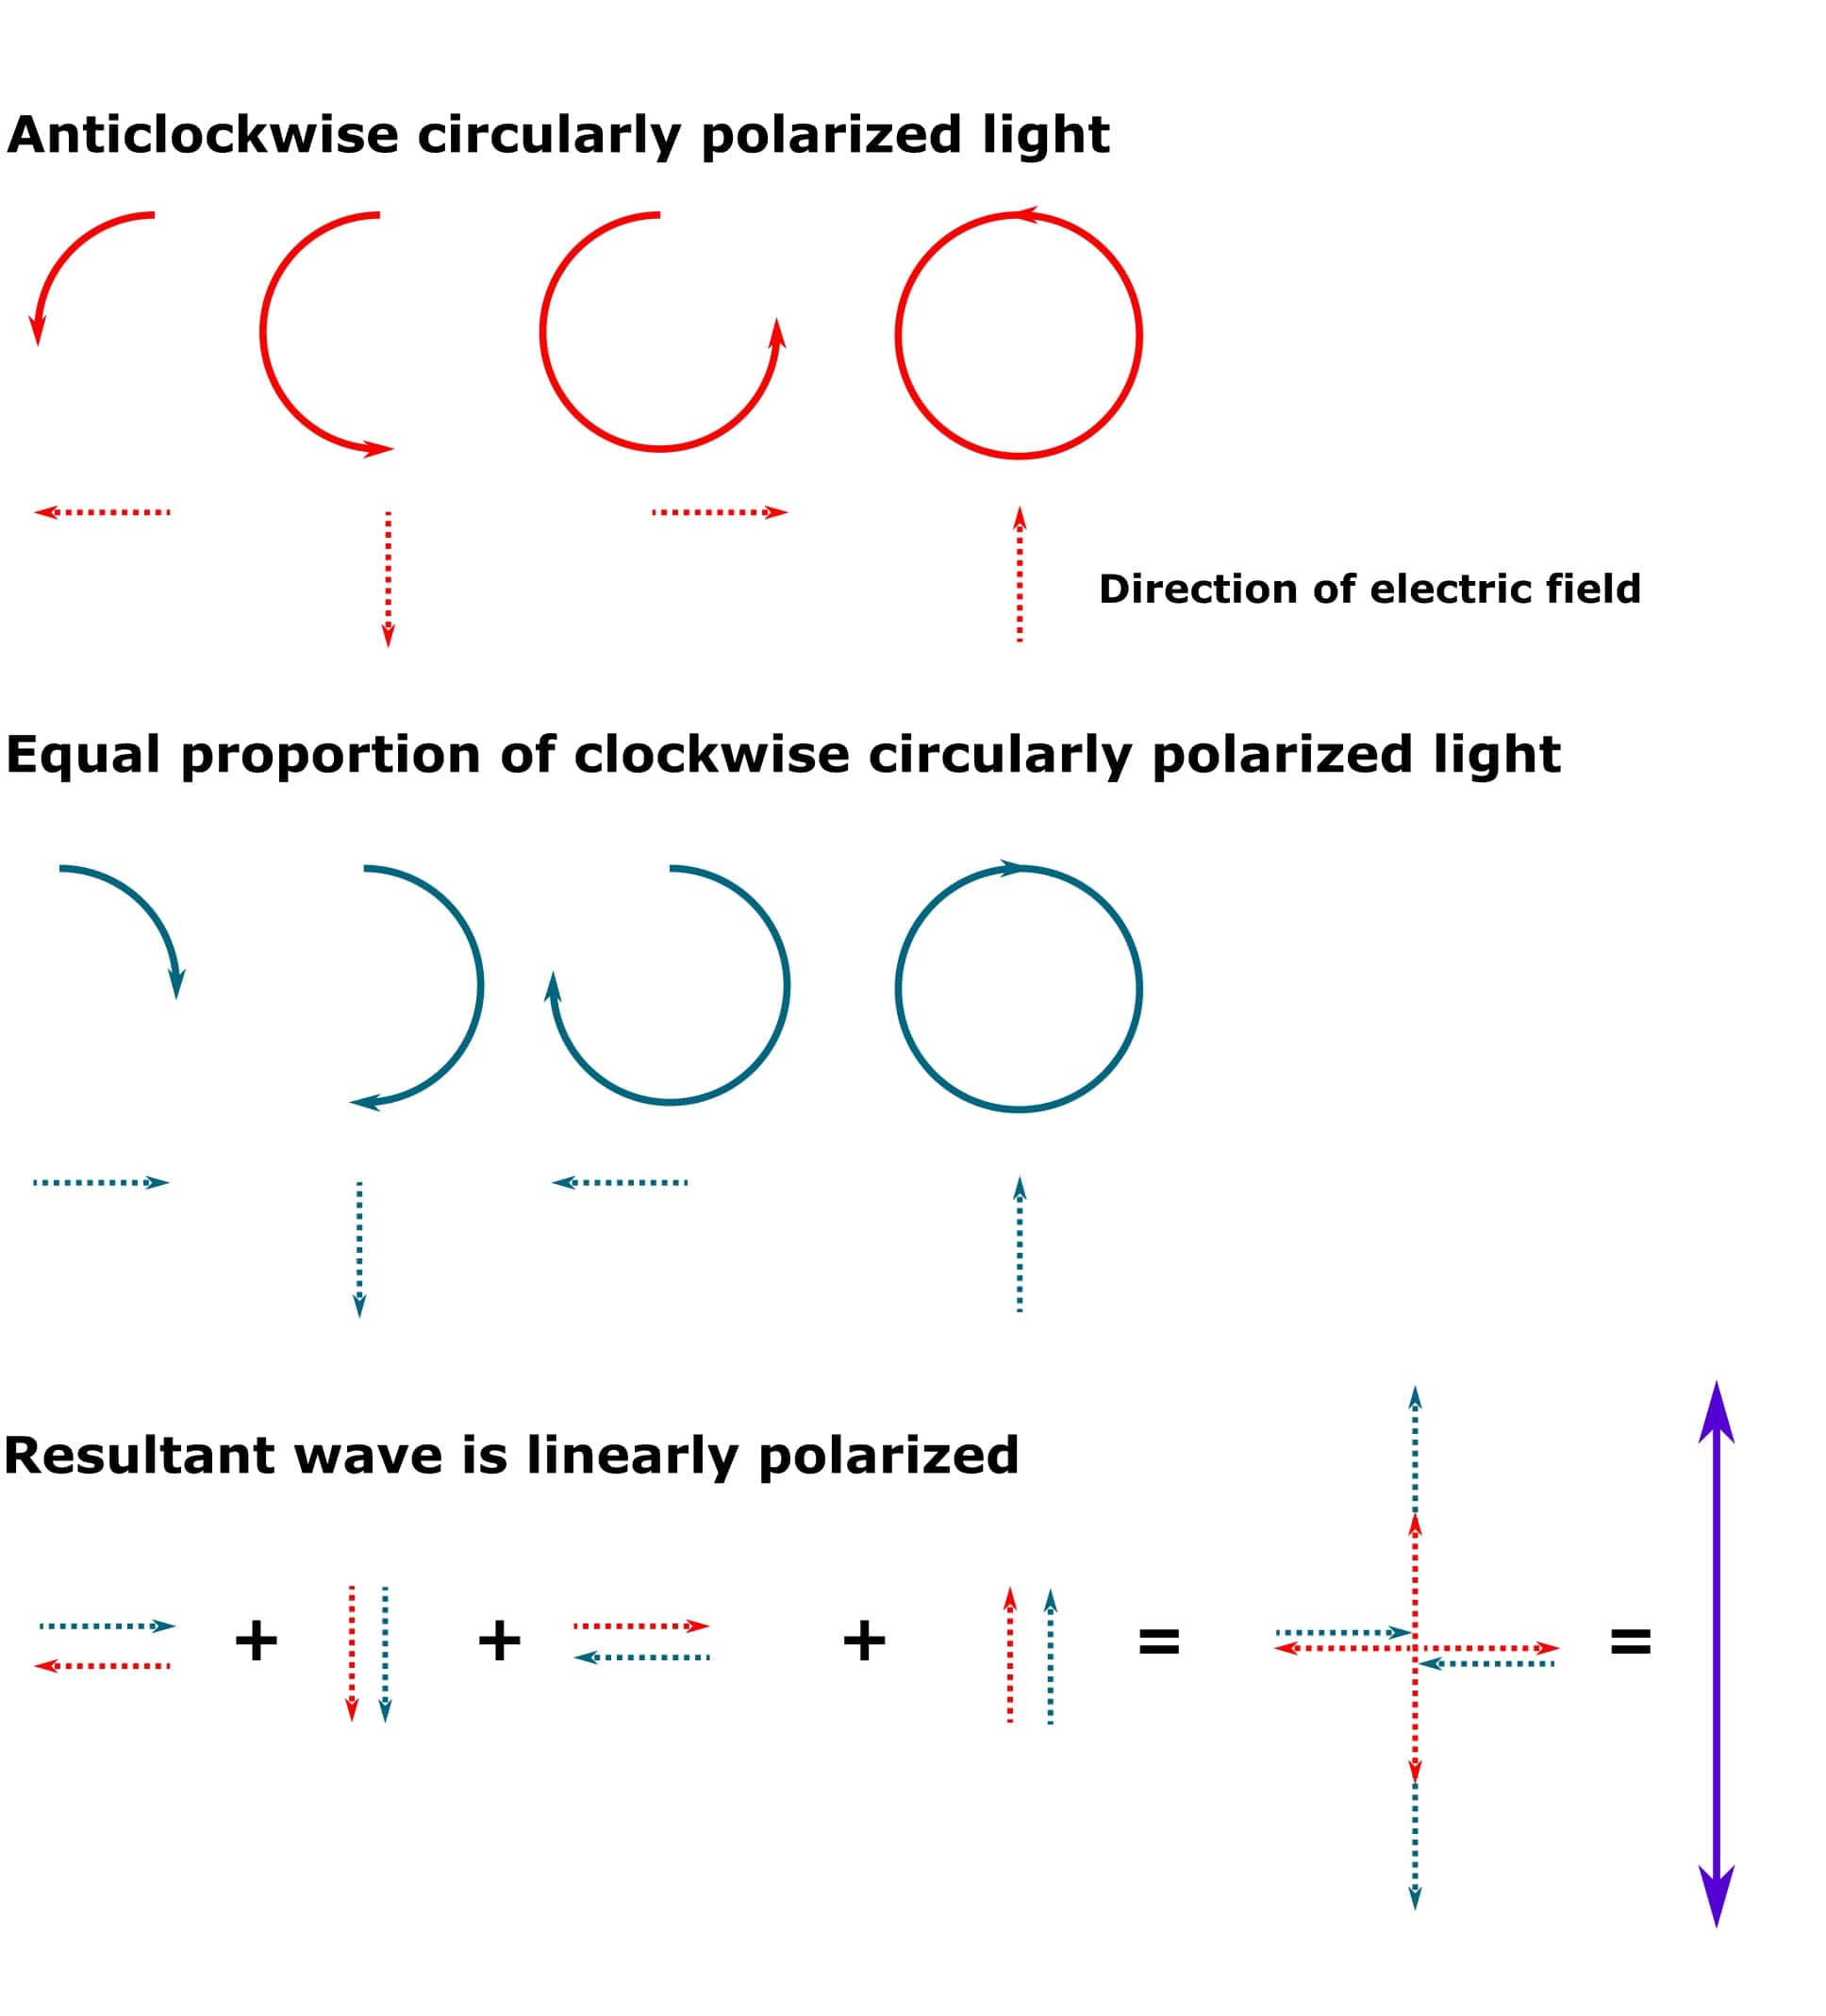
If the clockwise and anticlockwise circularly polarized photons are all in phase and we add them together, we get back to linearly polarized light (provided that both clockwise and anticlockwise circularly polarized photons also have the same wavelength and amplitude). See Figure 1 for details.
Oh, and “resultant” just means the wave that arises when two or more waves are combined together into a single one.
However, when a higher proportion of one direction is absorbed more strongly than the other, as would be the case in a protein sample, the resultant wave is an ellipse. See Figure 2. Note that the smaller circle for the clockwise circularly polarized light is taken to represent a higher degree of absorption by the chiral centers in the sample. However, it could also represent a wave with a lower amplitude (but the same wavelength) than the anticlockwise circularly polarized light. The result would be the same.
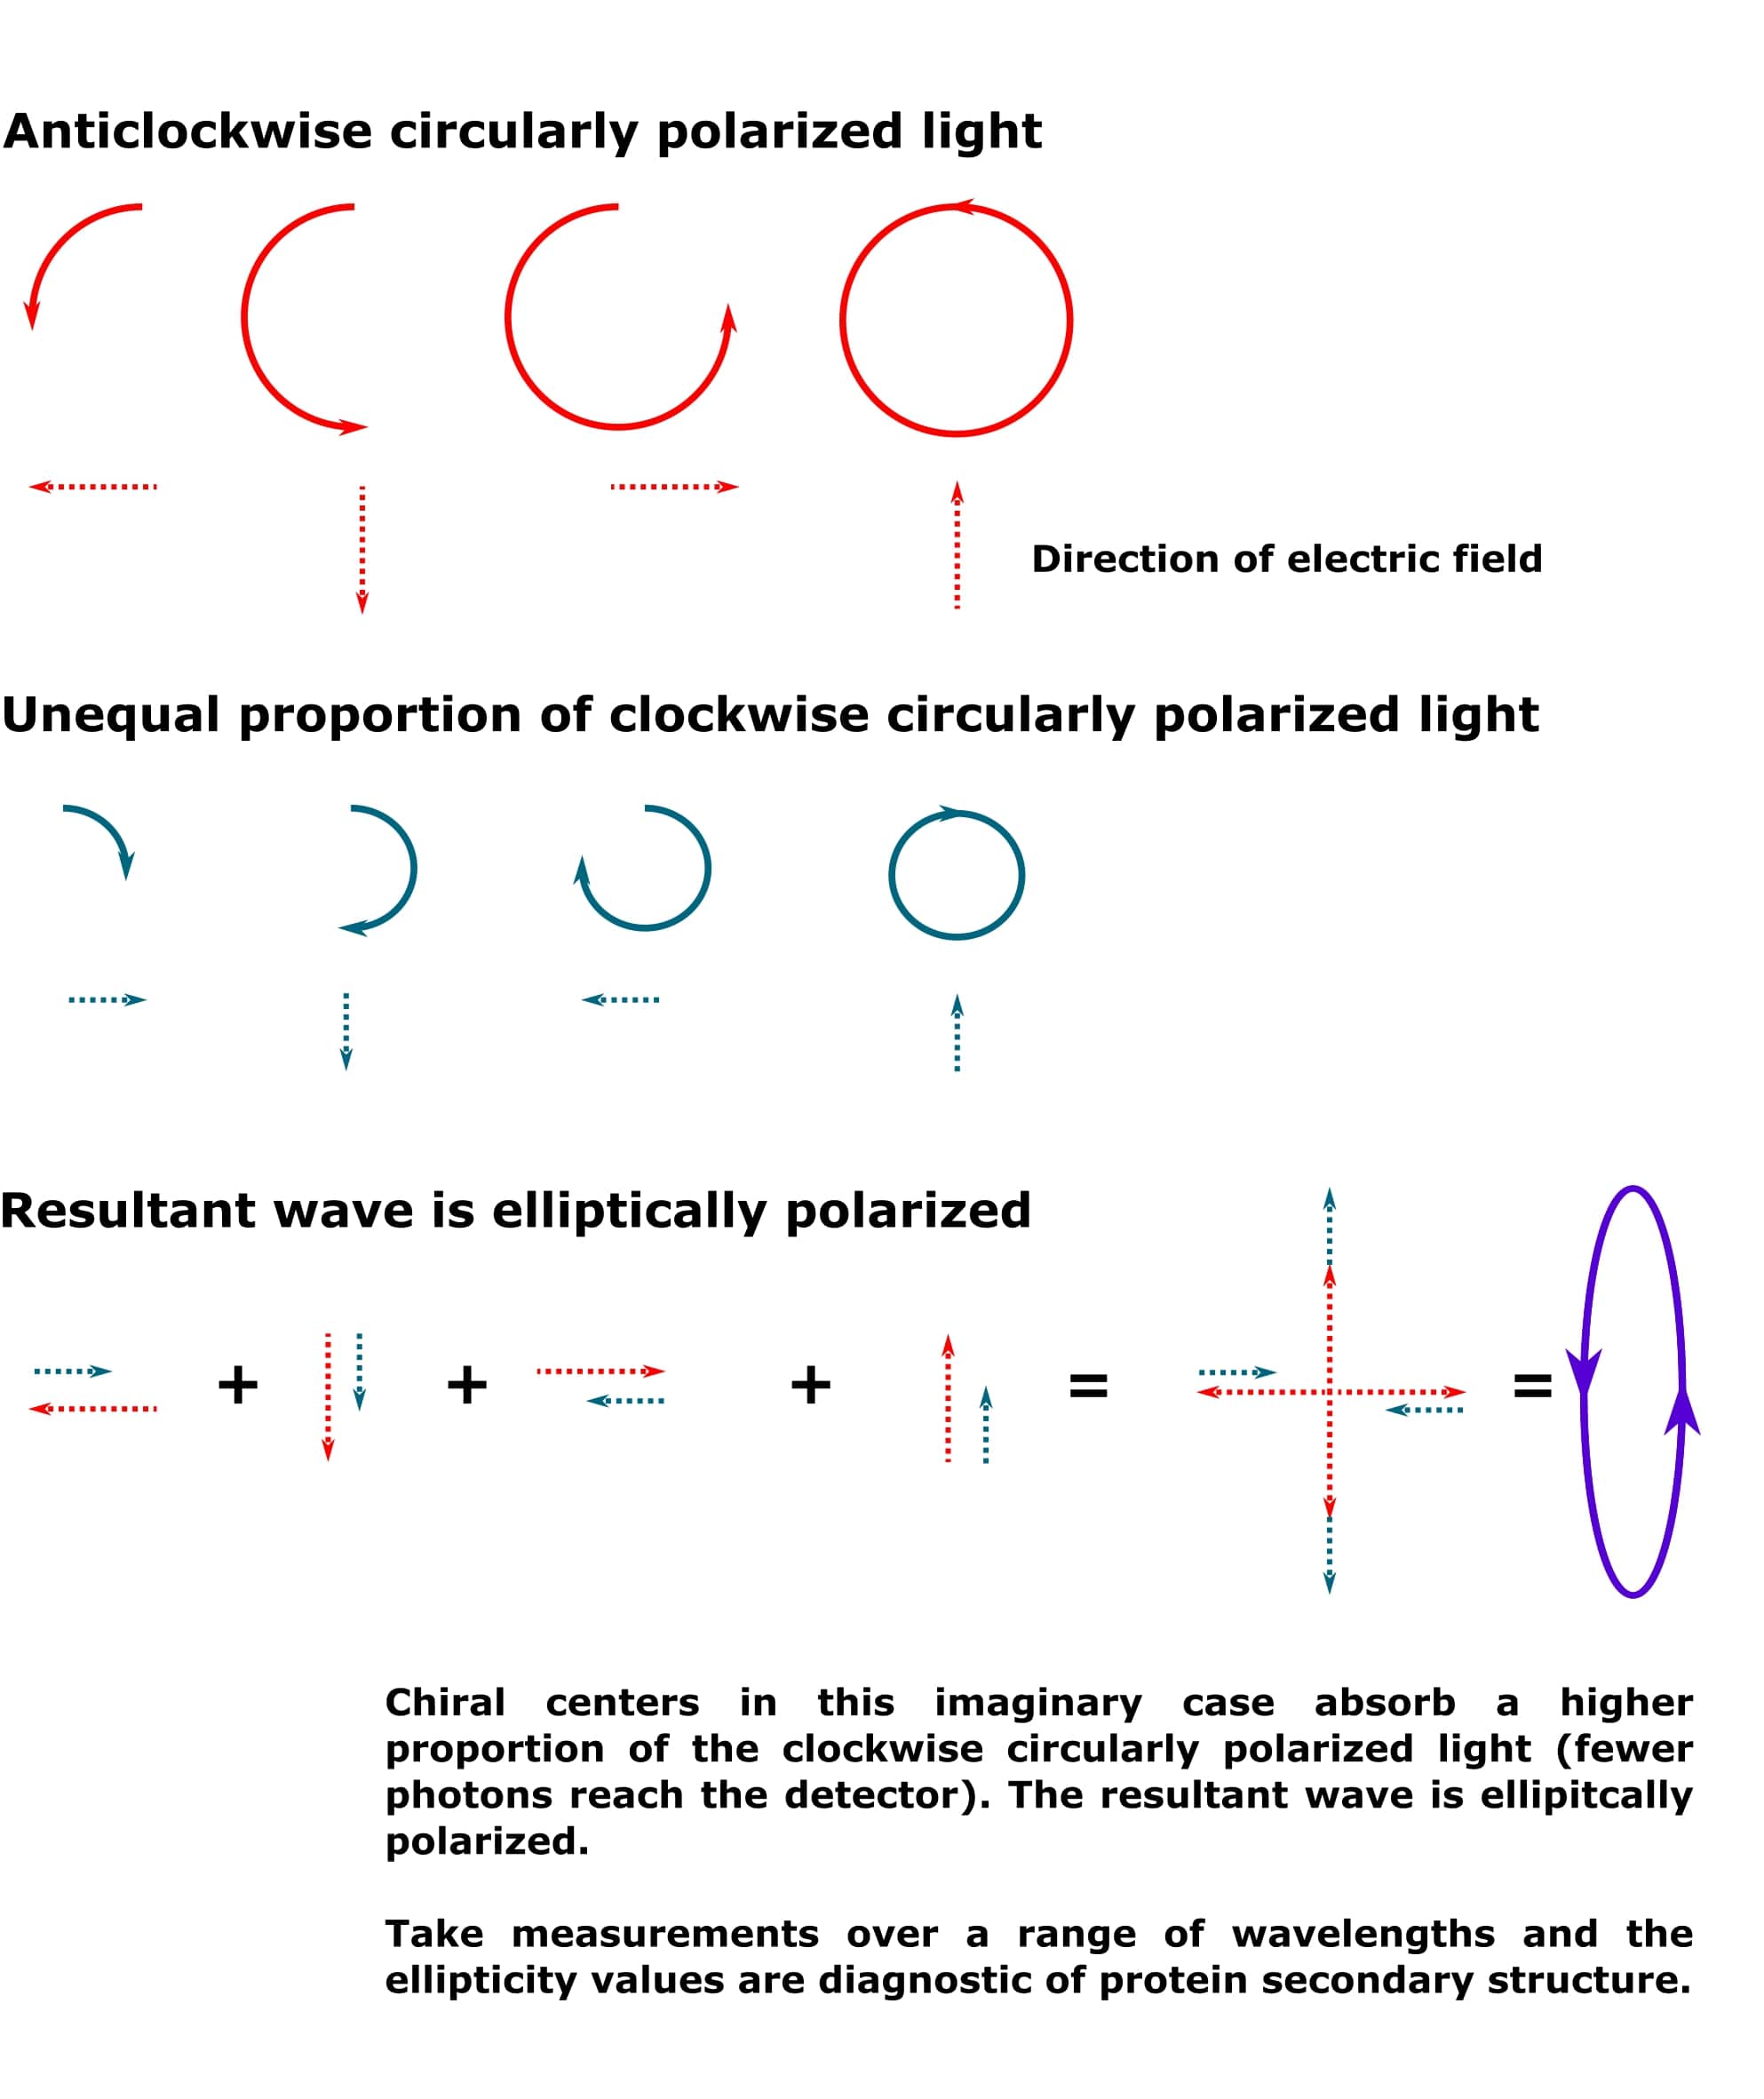
Because the chiral centers in a protein will absorb clockwise and anticlockwise circularly polarized light to different extents, the resultant light that passes from your sample to the detector is always elliptically polarized.
And the conformation of the chiral alpha carbons in a protein accurately describes its secondary structure.
Chiral centers are crucial to the circular dichroism experiment, therefore.
The extent to which chiral centers unequally absorb clockwise and anticlockwise light depends on the following three factors:
- Which enantiomer (L- or D-form) is present.
- The conformation of the chiral center.
- The local chemical environment of the chiral center.
We can control the chemical environment of the chiral centers by putting our protein sample in a well-defined buffer solution.
So, the degree of ellipticity of the resultant wave that arises after our sample has been shot with both clockwise and anticlockwise light is diagnostic of its secondary structure elements.
And in a CD experiment, ellipticity is measured over a range of wavelengths in the UV region, usually, λ = 180–260 nm.
If you’re still with me, you deserve a sticker! For an engineered domain whose conformation responds to light, see designing a LOV2 domain-based toolkit.
Hang around for part 2, where we’ll move on from CD theory and get into the fun (easier) stuff. This will get you ready to go and collect a CD spectrum from your sample.
Circular Dichroism Sample Preparation: 5 Practical Considerations
Although it’s helpful to know the theory behind your experiments so you can design them judiciously, it’s good to consider their practical and logistical aspects to enable you to optimize your sample and workflow.
To that end, here are five handy pointers on best circular dichroism sample preparation to set up your experiment properly.
1. Purge Your Circular Dichroism Spectrometer with Nitrogen Gas
The UV light to which you expose your sample during a circular dichroism (CD) experiment generates ozone from atmospheric oxygen. When ozone decomposes, it forms oxygen free radicals, which are reactive and extremely good at frying electronic circuitry.
A nitrogen purge provides an inert atmosphere to prevent you from wrecking that expensive spectrometer. So be sure to do this purge before any experiments are performed!
2. Degas Your Sample Buffer
Similarly, oxygen absorbs UV radiation at \(\lambda\) < 200 nm. To get a high-quality CD spectrum that’s not too noisy, we need to remove the dissolved oxygen from your sample buffer.
Most labs are equipped with degassing apparatus. The procedure involves gently stirring your buffer under vacuum for ~30 minutes. To get a rough idea of when your buffer is degassed, stop stirring it and inspect for bubbles on the stirrer bar. If no bubbles are visible, then your buffer is degassed. And, speaking of chemicals that absorb UV…
3. Avoid Sodium Chloride
Chloride anions also readily absorb short-wavelength UV radiation (I like to think of these species as being opaque to UV light) and must be avoided where possible.
This is because it’s the short-wavelength UV radiation that provides us with useful structural information.
Protein samples generally require salts to remain soluble, however. So good alternatives that don’t absorb short-wavelength UV as strongly as chloride are:
- sodium phosphate;
- potassium phosphate;
- potassium fluoride.
If you can’t omit sodium chloride altogether, try to limit its concentration to 50 mM. This is approximately the maximum concentration at which it can be present without completely tarnishing a CD spectrum.
4. Rubbish In, Rubbish Out: Prepare Your Sample Properly
Your sample needs to be >90% pure because contaminant proteins will have their own CD signature and may cause you headaches.
As for sample concentration, that will need practical determination. Start at several mg.ml-1 if possible, then prepare some dilutions and screen them all. Just take some sample buffer to the spectrometer with you and dilute your sample on the fly until you hit the sweet spot.
Ultimately, experience will tell you what the “sweet spot” is. Aim for a spectrum with a decent signal (i.e., one that isn’t a flat line) that doesn’t saturate whatever detector the CD spectrometer is equipped with.
The optimal concentration also depends on the path length of the cuvette. Generally, CD cuvettes are available at 1 and 10 mm. Either way, you’ll likely be working in the \(\mu\)g.ml-1 range.
The 1-mm cuvette option makes CD quite an economical technique with regard to the amount of sample required. And if you don’t intend on heating your sample protein to get a melting curve, you get it back at the end!
5. Care for Your Cuvette
No cheap-o disposable plastic cuvettes for CD, I’m afraid. The cuvettes are made of quartz, which, while not particularly exotic, needs looking after. Check out this handy article on cuvette cleaning for some excellent tips.
Analyzing Your Circular Dichroism Data
You can be the most diligent scientist in the world and adhere to the above circular dichroism practice pointers, but it’s useless if you can’t analyze your data. Here are some pointers to get you going.
Your raw circular dichroism data will be a series of measured ellipticity values for every wavelength in the range specified at the start of the experiment.
Ellipticity takes the units 10-3 degree centimeters squared per decimole (10-3 degrees.cm2.dmol-1). Thankfully, it’s often just written as mDeg or CD. Let’s stick with mDeg for now.
As mentioned already, you can introduce temperature as a variable if you wish to generate a melting curve for your sample.
Plotting ellipticity against wavelength generates a CD spectrum from which the secondary structure composition of your sample can be inferred. The extreme cases of 100% alpha-helix, 100% beta-sheet, and 100% random coil are shown in Figure 1.
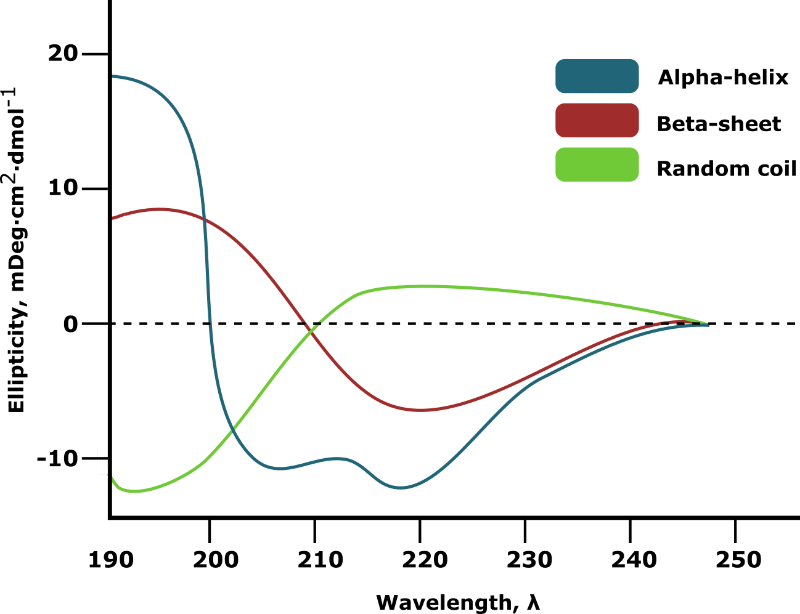
In most cases, your target protein will contain a mixture of secondary structure elements. The relative proportion of each will be virtually impossible to deduce from manual inspection of the spectrum.
Fear not, however, because computational tools can calculate this information (see below for details). However, you’ll need an accurate measure of your sample concentration to get accurate results.
Melting points can be constructed by first collecting CD spectra over a range of temperatures. Then, plot ellipticity at a single wavelength (e.g., mDeg at \(\lambda\) = 210 nm) for every temperature point. You may need to try a few different wavelengths to generate a decent sigmoid.
Apply a sigmoidal fit to the data, and the melting point, Tm, of your sample protein can be calculated from the mid-point of the sigmoid.
Tools for Interrogating Circular Dichroism Data
If you’re lucky, the software that comes with the circular dichroism spectrometer may enable you to graph and interrogate your data. If not, don’t panic, as there are plenty of third-party tools to do this.
The online CD analysis and plotting tool (CAPITO) [1] is reasonably intuitive and can get you started. Otherwise, there are installable programs such as CDtoolX. [2] Both of these tools are free but be sure to ask your resident biophysicist for other options.
From the Vault: My Example Data
I like to show and tell, so check out Figure 2 for some CD data I collected for a troublesome alpha-helical transmembrane protease to bring some reality to all this information.
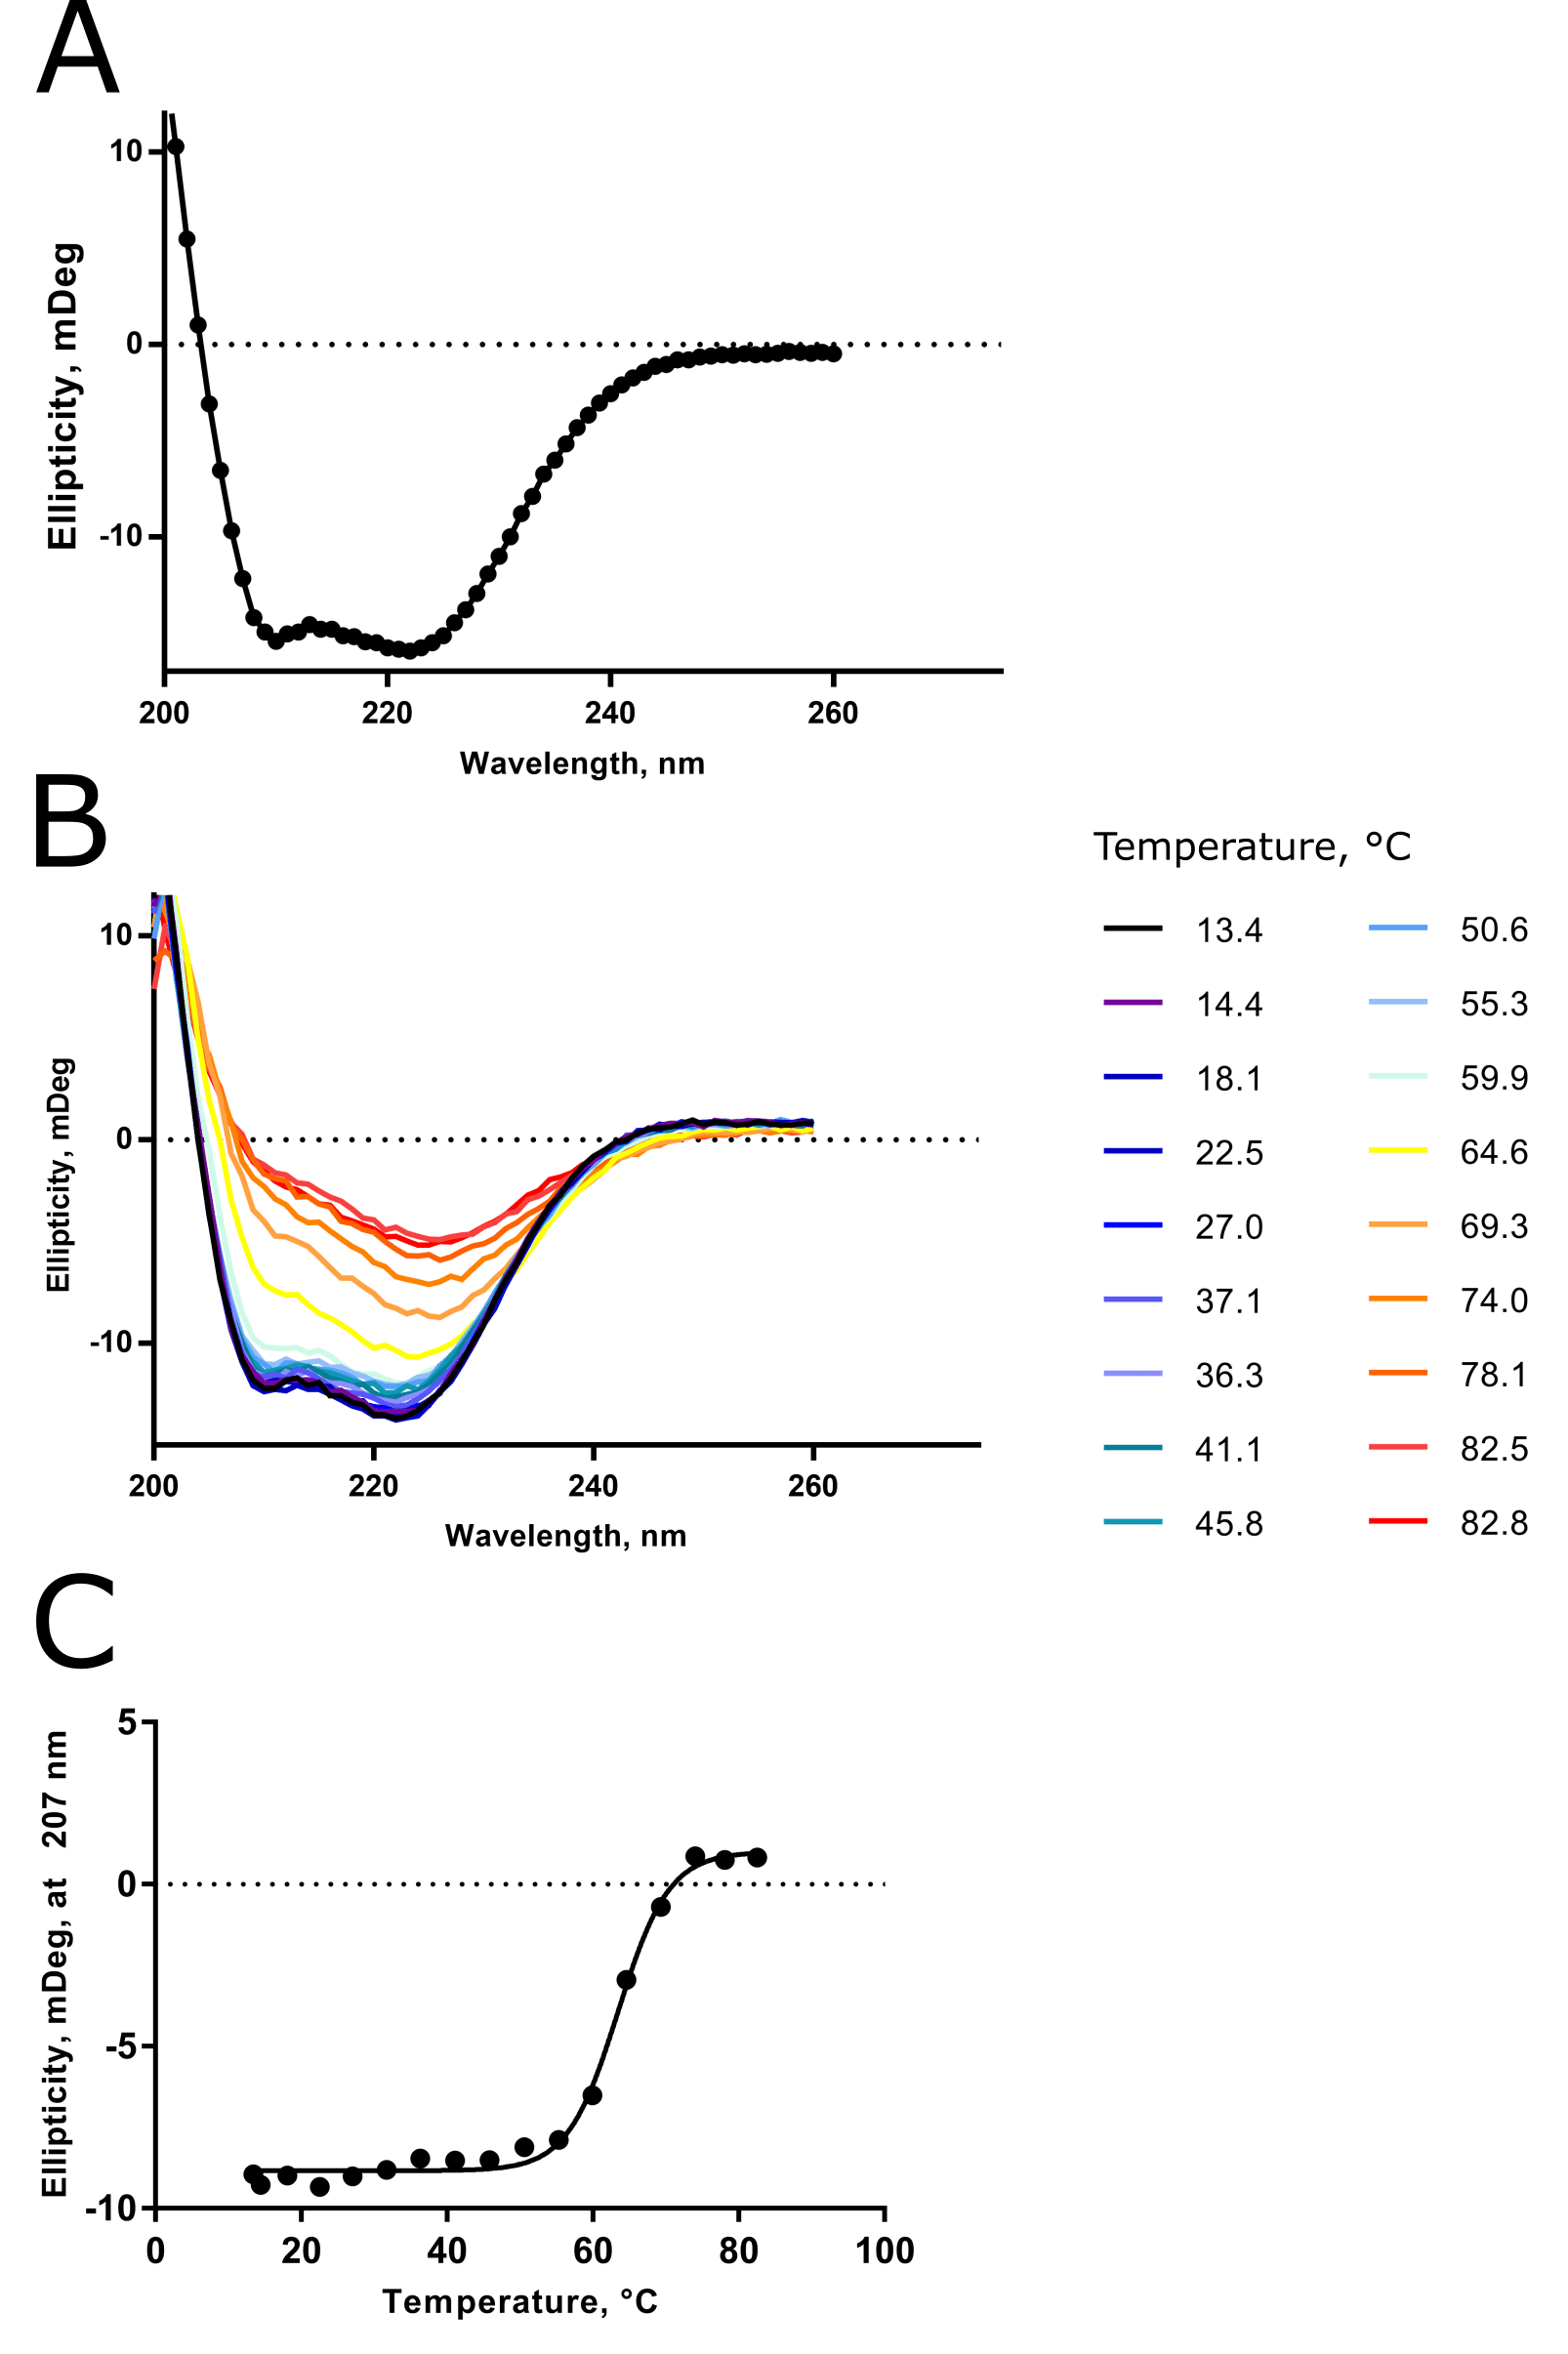
At the time, I had no activity assay, no structure (this is still true), and a funny-looking gel filtration chromatogram due to detergent adsorbing to the column stationary phase. I was happy to learn, via CD, that my sample was folded and relatively thermostable.
In particular, the “double dip” to the room-temperature spectrum at approx \(\lambda\) \(\approx\) 210 and 225 nm told me that my sample was >90% alpha-helical in composition. This result agreed with secondary structure predictions that I had made previously.
The loss of this double dip feature with increasing temperature told me that my protein was unfolding, as you’d expect for thermal denaturation. And spectra taken at ~80°C during the variable-temperature run clearly resemble the 100% random coil scenario presented already in Figure 1.
And finally, from the variable-temperature CD spectra, I was able to determine the Tm of the protease to be ~62°C.
At this point in time, I was used to experiments on membrane proteins failing entirely, and I was glad of some solid data. I wish you gratifying results too.
References
- Christoph W, Peter B, and Matthias G (2013) CAPITO—a web server-based analysis and plotting tool for circular dichroism data. Bioinformatics 29:1750–57
- Andrew J and Miles W (2018) CDtoolX, a downloadable software package for processing and analyses of circular dichroism spectroscopic data. Protein Sci 27:1717–22
- Greenfield NJ (2006) Using circular dichroism spectra to estimate protein secondary structure. Nat Protoc 1:2876–90
You made it to the end—nice work! If you’re the kind of scientist who likes figuring things out without wasting half a day on trial and error, you’ll love our newsletter. Get 3 quick reads a week, packed with hard-won lab wisdom. Join FREE here.


