
It could be said that chemistry ends and biology begins at activity. Chemicals have reactivity, and biomolecules have activity. Simple enough, right? Hence the need for us biologists to be familiar with an impressive arsenal of assays to measure sample activity and move our research forwards.
A good few assay techniques are already discussed on Bitesize Bio; for example, check out our articles on the luciferase reporter assay and the MTS cell viability assay.
In this article, we’ll discuss the thermal shift assay, its principles, and its applications and go over a basic protocol for setting the assay up to get you underway.
What Is the Thermal Shift Assay?
The thermal shift assay (also known as the thermofluor assay or differential scanning fluorimetry) is a protein melting point assay. [1] Two factors make it very useful:
Choose a free resource to help you move forward
DOWNLOAD
Western Blot Troubleshooting Card
EBOOK
Free Guide to Protein Expression
- Because it’s performed in a real-time PCR machine, it’s high throughput. You can try 96 conditions at once if you so wish.
- The melting point (Tm) of the target protein is taken as a proxy measurement of its stability. Protein stability is usually altered by ligand binding, and biological ligands are, of course, quite varied. And this is where things get interesting.
An increase in target protein melting point relative to the unliganded (apo) form implies that a ligand has bound to it and stabilized it. A decrease in target protein melting point implies that a ligand has bound to, and destabilized it.
The thing is, it’s not only ligand binding that affects a protein’s melting point. The chemical environment of a protein also has an effect, and that’s where the thermal shift assay has further applications.
What’s the Principle Behind It?
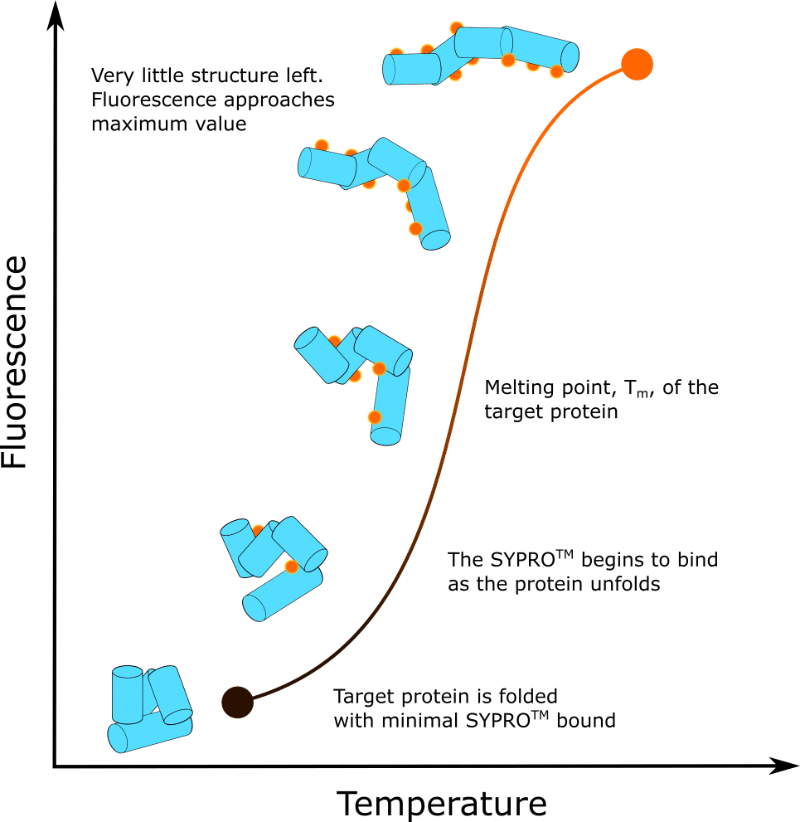
So, you take your protein of interest in a well-defined sample buffer, place it in the PCR machine, and gradually heat it up in the presence of a dye called SYPRO™ orange. As the protein heats up, it will begin to unfold and expose its hydrophobic interior. SYPRO™ orange binds non-specifically to hydrophobic residues and, in doing so, experiences reduced “fluorescence quenching.”
Fluorescence quenching basically means “reduced fluorescence” and it’s the water molecules that cause it in this instance.
Think of it this way: when your target protein is fully folded, the SYPRO™ orange molecules cannot bind to it. At this point, the SYPRO™ orange molecules are completely surrounded by water, and the fluorescence quenching effect is at its maximum—minimal fluorescence.
Unfold your target protein, however, and SYPRO™ orange will stick to the exposed hydrophobic interior. In so doing, some of the SYPRO™ orange molecules will be “hidden” from water and the fluorescence quenching effect is reduced, resulting in, you guessed it—more fluorescence!
The hotter you go, the more your target protein will unfold, the more the SYPRO™ orange molecules will bind to it, and the more they will fluoresce.
In short, fluorescence is a function of sample temperature. This is shown in Figure 1.
What Data Will I Get?
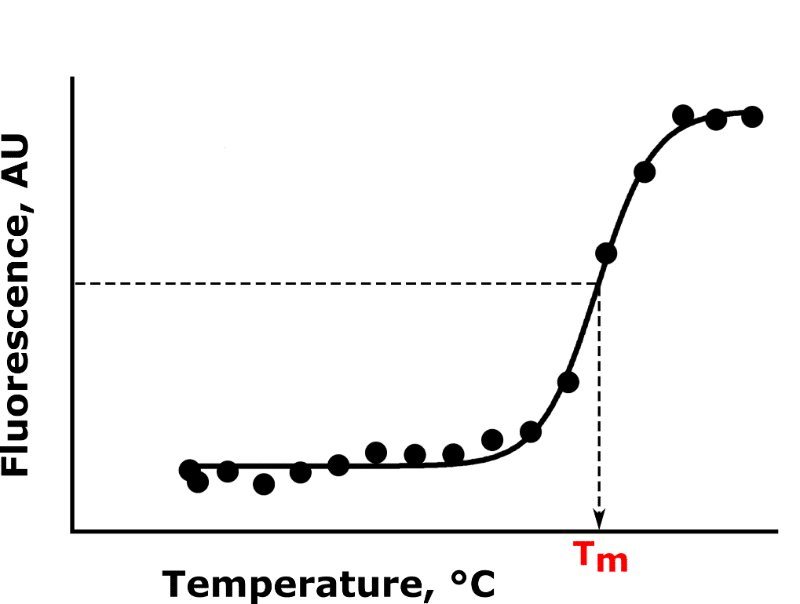
Your raw data will be fluorescence counts, in arbitrary units, per unit temperature change, in °C. The change in fluorescence with temperature obeys a sigmoidal relationship. The mid-point of the sigmoid corresponds to the melting point of your target protein (we’ll come back to this later).
Be aware that at very high temperatures, fluorescence may start to decrease. This is because there’s enough thermal energy in the system to cause the SYPRO™ orange molecules to dissociate from the unfolded protein.
And Its Applications?
I said earlier that things get interesting because of the variety of biological ligands. So, here are a few applications of the thermal shift assay.
1. Intrinsic Melting Point Analysis
It should be obvious, but the Tm of your target protein may not actually be known. So use the thermal shift assay to find it out.
2. Fragment Screening in Drug Discovery
Fragment screening is an approach in drug discovery research in which potential drug molecules are incrementally built up from smaller chemical units. [2] This is done by testing for any therapeutic benefit (usually inhibition of the target protein) when said fragments are exposed to the target protein.
Because the fragments are small, they don’t always significantly perturb the activity of the target sample. They are usually detectible using the thermal shift assay, however, which will tell you:
- If they’ve bound to the target protein (is there any change in its Tm?).
- The extent of their stabilizing or destabilizing effect (the magnitude of the change in Tm).
Furthermore, fragment screening approaches typically study hundreds of fragments, with tens of thousands of possible combinations. Thus, the high throughput nature of the thermal shift assay is a huge benefit and can be used to explore the structure–activity profile of nascent inhibitor molecules.
3. Buffer Screening
Having your target protein in a sample buffer that’s compatible with your intended experiment is an important consideration. For example, Circular Dichroism (CD) requires \(\leq\) 50 mM NaCl because chloride (Cl–) anions interfere with the CD measurement. [3]
Many chemical ligands, especially lead compounds in drug discovery projects, are soluble only in mixtures of water and DMSO. So can your target protein even tolerate DMSO?
And let’s not even talk about protein crystallography, where minute perturbations in target protein stability imparted by the sample buffer can be the difference between success and failure. [4]
The thermal shift assay allows you to test the effect of all sorts of parameters like pH, ionic strength, and inclusion of (hopefully) beneficial additives on your sample all at once because all of these may alter the Tm of your target protein.
4. And Many More
If you think about it, the thermal shift assay is a powerful and label-free method to detect if pretty much anything binds to your target protein and affects its stability.
So, use it to detect oligomerization, protein–protein complex formation, and whether or not mutations affect sample stability. Whether or not the thermofluor assay is actually appropriate to screen for these things depends somewhat on the specific complicating factors of the system you’re researching.
There’s a Downside to Everything
We’ve covered a lot there, so let’s lump it all together as positive and consider a few of the downsides, which are summarized in Table 1.
Table 1. Pros and cons of the thermal shift assay.
Pros | Cons |
High throughput method. So you can test lots of conditions at once or do lots of replicates | Arguably information-poor since you are just determining one number |
Requires only a real-time PCR machine and your time | Not all real-time PCR machines output fluorescence data in a way that makes graph generation easy |
Requires relatively low amounts of sample | Destructive method |
Lots of possible applications | Difficult to determine what counts as a change in Tm |
Can use different fluorescent dyes to widen the applicability | |
Label-free |
What counts as a bona fide change in Tm is a good question because it affects the interpretation of your results and, ultimately, what you tell the scientific community in your publication.
While opinions may differ, taking a 0.5–1°C degree change in Tm to mean that an experiential condition has had a significant effect on your sample is safe enough.
Does It Work for Membrane Proteins?
Yes, with caveats. You’ll need to use a different dye called, ahem:
N-[4-(7-diethylamino-4-methyl-3-coumarinyl)phenyl]maleimide. [5]
There’s a very safe Wi-Fi password for you. (It’s abbreviated as CPM.) Because SYPRO™ orange binds non-specifically, it will just bind to the alkyl chains of the detergent molecules and fluoresce.
CPM is a thiol (containing the –SH functional group) specific dye and reacts only with exposed cysteine residues. Be sure to check the primary sequence of your membrane protein to make sure it actually has a few cysteines, but it probably does because it’s a hydrophobic residue.
Also, try to get rid of as much excess detergent as you can. In theory, it shouldn’t matter as CPM shouldn’t interact with the detergent molecules. But you don’t need me to tell you that “shouldn’t” and “doesn’t” are two very different things in science.
A Simple Thermofluor Assay Protocol
Knowing the theory and possibilities is all well and good, but unless you can go and set up the assay in your lab, that knowledge is kind of useless. So, here’s a simple protocol to get you on your way.
1. Prepare Your Samples
a. Overexpress or otherwise obtain your target protein in crude form.
b. Purify your target protein using Ni2+-affinity chromatography or another suitable technique such as ion-exchange chromatography and confirm sample presence by SDS-PAGE.
c. Concentrate your target protein to ~0.35 mg mL-1.
NOTE 1: Each thermal shift assay experiment volume is typically 50 µL in clear PCR tubes.
NOTE 2: We’ll assume that contaminants still account for ~50 % of the absorbance of your sample at \(\lambda\) = 280 nm and that the calculated target protein is overestimated because of this.
NOTE 3: Each thermal shift assay experiment requires ~10 µg of the target protein.
d. Prepare samples as per Table 2 below. (Yep. I’ve done the thinking for you.)
Table 2. A summary of experimental and control sample compositions for a thermal shift assay to determine the Tm of a target protein.
Experiment # | Vol. of 0.35 mg mL-1 sample, µL | Vol. of 10 x SYPRO™, µL | Vol of buffer*, µL |
1 | 30 | 5 | 15 |
2 | 30 | 5 | 15 |
3 | 30 | 5 | 15 |
Control # | |||
1 | 0 | 5 | 45 |
2 | 0 | 5 | 45 |
3 | 0 | 5 | 45 |
*Buffer is taken to mean your sample buffer (i.e., the solution in which your target protein is purified).
NOTE 4: SYPRO™ orange is supplied as a 5000x stock in DMSO, so make 500-fold dilution into DMSO to get a 10x stock.
NOTE 5: Table 2 is for the determination of sample Tm only but may be adjusted to your intended application.
2. Perform the Assay
a. Place samples in a real-time PCR machine set to the ROX orange filter channel or another channel suited to detecting orange light. SYPRO™ orange has an absorption maximum at \(\lambda\) = 470 nm and an emission maximum at \(\lambda\) = 570 nm.
b. Program the real-time PCR machine to heat the samples at 1°C min-1 from 25 to 90°C and record fluorescence at, or near, \(\lambda\) = 570 nm.
3. Plot and Interpret the Results
a. Plot fluorescence counts vs. temperature for each experimental condition. The sample conditions should produce a sigmoidal curve as per Figure 2.
b. Apply a sigmoidal line of best fit to the sample data using (for example) Prism.
c. The Tm of the target protein is the temperature that corresponds to the inflection point (middle) of the sigmoidal line of best fit (see Figure 2).
d. Repeat for all experimental conditions.
NOTE 6: When handling large numbers of data, it may be better to plot all the Tm values on a waterfall plot [6] or heat map. [7]
Final Points
Fluorescent dyes for the thermal shift assay aren’t limited to SYPRO™ orange and CPM. Be sure to check out this Wiki entry on the thermal shift assay to read about a few more.
Intrinsic fluorescence from tryptophan residues may also be used to monitor protein unfolding, but the workflow isn’t the same. [8]
And there we have it: the hard and fast rules of the thermal shift assay and its applications. Of course, when covering such large amounts of scientific ground, there will be caveats and omissions. Please share any salient points I may have omitted in the comments section below!
Similarly, if you have developed some cool experimental designs, why not share those too?
And take your protein purification game to the next level with our two free eBooks: The Bitesize Bio Guide to Protein Expression and Five Methods for Assessing Protein Purity and Quality.
References
- Semisotnov GV et al. (1991) Study of the “molten globule” intermediate state in protein folding by a hydrophobic fluorescent probe. Biopolymers 31:119–28
- Murray C and Rees D (2009) The rise of fragment-based drug discovery. Nature Chem 1:187–92
- Greenfield NJ (2006) Using circular dichroism spectra to estimate protein secondary structure. Nat Protoc 1:2876–90
- McPherson A and Gavira JA (2014) Introduction to protein crystallization. Acta Crystallogr F Struct Biol Commun 70:2–20
- Alexandrov AI et al. (2008) Microscale fluorescent thermal stability assay for membrane proteins. Structure 16:351–9
- Gillespie TW (2012) Understanding waterfall plots. J Adv Pract Oncol 3:106–11
- Wilkinson L and Friendly M (2009) The History of the Cluster Heat Map. Am Stat 63:179–84
- Ghisaidoobe AB and Chung SJ (2014) Intrinsic tryptophan fluorescence in the detection and analysis of proteins: a focus on Förster resonance energy transfer techniques. Int J Mol Sci 15:22518–38
You made it to the end—nice work! If you’re the kind of scientist who likes figuring things out without wasting half a day on trial and error, you’ll love our newsletter. Get 3 quick reads a week, packed with hard-won lab wisdom. Join FREE here.


 6")

