If you are performing quantitative PCR (qPCR), then it’s crucial you understand what a Ct value is. We’ll take you through its critical role in qPCR, its varying names, how it’s calculated, and what it means when it all seems to go a bit wrong.
The Many Names of the Ct Value
Before we dive into explaining what a Ct value is, we want to take a moment to highlight that that value has been given multiple names over the years, including:
- Ct – cycle threshold/threshold cycle
- Cp – crossing point
- TOP – take-off point
- Cq – quantification cycle
These values are all the same, just with different names. To standardize qPCR nomenclature, the MIQE (minimum information for publication of quantitative real-time PCR experiments) guidelines recommend using Cq value. These guidelines standardize experimentation and reporting, which is critical given that quantitative real-time PCR is used to analyze clinical samples and diagnose mild and severe disease, notably SARS-CoV-2 infections. Therefore, throughout this article, we will use Cq only. [1]
What is the Cq Value?
Real-time PCR (often called qPCR) is usually conducted to quantify the absolute amount of a target sequence or to compare relative amounts of a target sequence between samples. This technique monitors the amplification of the target in real time via a target-specific fluorescent signal emitted during amplification.
Even though real-time PCR fluorescent dyes and probes should be sequence-specific, a considerable amount of background fluorescence occurs during most real-time PCR experiments. It is critical to bypass or account for this background signal to glean meaningful information about your target. This issue is addressed by two values in real-time PCR: the threshold line and the Cq value.
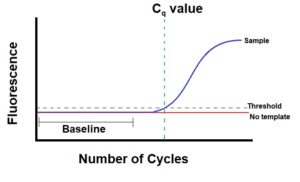
- The threshold line is the level of detection or the point at which a reaction reaches a fluorescent intensity above background levels. Before conducting PCR, you (or the software in your cycler) set a threshold level. This is literally a line in your graph that represents a level above background fluorescence, that also intersects your reaction curve somewhere at the beginning of its exponential phase (Figure 1).
- The Cq value is the PCR cycle number at which your sample’s reaction curve intersects the threshold line. This value tells how many cycles it took to detect a real signal from your samples. Real-time PCR runs will have a reaction curve for each sample and therefore many Cq values. Your cycler’s software calculates and charts the Cq value for each of your samples.

Cq values are inverse to the amount of target nucleic acid in your sample and correlate to the number of target copies in your sample. Lower Cq values (typically below 29 cycles) indicate high amounts of the target sequence. Higher Cq values (above 38 cycles) mean lower amounts of your target nucleic acid. High Cq values can also indicate problems with the target or the PCR set-up, as outlined later in the pitfalls section of this article.
Your PCR instrument will collect fluorescence data during each cycle. After about 15 cycles, you’ll have a good idea of your background fluorescence level – this will appear as a horizontal line starting from the zero cycle point. The threshold level will be just above this but at the point where your samples start moving into the exponential phase of PCR amplification. Today, computer software calculates this exact point, and all modern real-time cyclers have an automatic threshold line setting.
Real-time PCR records the amount of fluorescence emitted during the reaction where all PCR components are abundant. In this way, Cq values are usually consistent across replicates in real-time PCR. By the time the PCR reaction endpoint is reached, accumulated inhibitors, inactivated polymerases, and limiting reagents create a lot of variation in endpoint values, and this is why conventional PCR cannot be used quantitatively.
Factors That Can Influence Ct Values
Many factors can affect your Cq values. Some differences in Cq values between your samples will be due to biological events, e.g., up/down-regulation of your target gene in response to a treatment. However, Cq values are just as easily influenced by the preparation of the PCR reaction and the PCR components themselves. The most common pitfall areas are:
1. Master Mixes
Fluorescence emission can be affected by pH and salt concentration in a solution. Any change in fluorescence emission will naturally change your Cq values. Therefore, make sure you only use high-quality PCR components, and if using homemade solutions, check the pH and monitor salt precipitation before each experiment.
2. Passive Reference Dyes
Reaction values are the ratio of the fluorescence of your FAM (reporter) dye to your ROX (passive reference) dye. Lower amounts of ROX produce higher reaction values, assuming FAM fluorescence doesn’t change.
3. Reaction Efficiency
PCR reaction efficiency is dependent on the master mix performance, the specificity of the primers, the primer annealing temperature, and the sample quality. In general, PCR efficiency above 90% is acceptable. PCR efficiency of 100% indicates that the target sequence of interest doubles during each cycle. Perfect PCR efficiency coincides with a change of 3.3 cycles between 10-fold dilutions of your template.
To determine the PCR efficiency for each primer pair, run serial dilutions of your template with five 10-fold dilution steps and calculate the R2, which is a statistical measure that describes how well one value can predict another. For PCR efficiency close to 100%, your R2 value should be greater than 0.99.
Run at least three replicates for each point on your standard curves. A higher replicate number is especially important for low copy number input, where variations across replicates are more likely.
4. Other Issues
Assuming you have ruled out the three factors mentioned above, the most common causes of late Cq values are:
- Too little template – try using more template.
- Suboptimal nucleic acid isolation – consider your nucleic acid isolation protocol, quantify your DNA, run an agarose gel, or try another protocol/kit.
- Poor reverse transcriptase activity during cDNA synthesis – reverse transcriptase is sensitive to degradation. Order a new one.
- RNA/cDNA degradation – keep your workspace clean, improve your RNA handling behavior, and avoid multiple freeze-thaw cycles of cDNA.
- PCR inhibition. [2]
Additional causes include infection or contamination in your cell line/culture, but these issues are usually spotted ahead of nucleic acid isolation.
Calling Delta-Delta Cq
To be certain that the variations in Cq values are due to real biological changes and not technical issues, you will need to normalize your results. The most popular normalization method is known as “Delta-Delta Ct” or the Livak method. Here, you compare the Cq values of your sample to the Cq values of several reference (housekeeping) genes.
It is imperative to choose reference genes whose expression levels are not expected to change during your experiment. Common housekeeping genes include actin, alpha-tubulin, GAPDH, and ubiquitin. It is wise to use at least two reference genes and bear in mind that what may be a reference gene for one study may not be suitable for another.
The Delta-Delta Cq method makes a key assumption—that the amplification (PCR) efficiencies of your reference and target samples are almost 100% and within 5% of each other. Other normalization methods include the Delta-Cq method and the Pfaffl Method. You can read more about the qPCR data analysis methods here.
Ct Values Summed Up
Hopefully, this article has helped you get a grip on Cq values. If you want more information on qPCR, make sure you check out our top 11 qPCR Papers Every Researcher Should Know.
For a more comprehensive guide to PCR and PCR parameters, download our free PCR fundamentals eBook and become an expert.
Originally published in July 2015. Updated and republished in November 2020. Revised and updated again in October 2023.
References
- Bustin SA, et al. The MIQE guidelines: minimum information for publication of quantitative real-time PCR experiments. Clin Chem. 2009. 55(4):611–22. doi: 10.1373/clinchem.2008.112797.
- Schrader C, et al. PCR inhibitors – occurrence, properties, and removal. J Applied Microbiology. 113(5):1014–26. doi: 10.1111/j.1365-2672.2012.05384.x


