In the 30 odd years since its invention, the polymerase chain reaction (PCR) has become the bread and butter technique of molecular biologists. The secret to its indispensability lies in its simplicity and versatility. Numerous variants of the technique have been developed; one of these, real-time PCR, has become the method of choice for quantitative studies of gene expression, determining pathogen loads in clinical samples, and detecting SNPs/mutations.
What is Real-time PCR?
Real-time PCR, as the name suggests, measures the amount of PCR product at the end of each amplification cycle (i.e., in real time). To do this, you label the PCR products during or after the primer extension step of each amplification cycle. Let’s see how this is done.
Real-time PCR detection methods
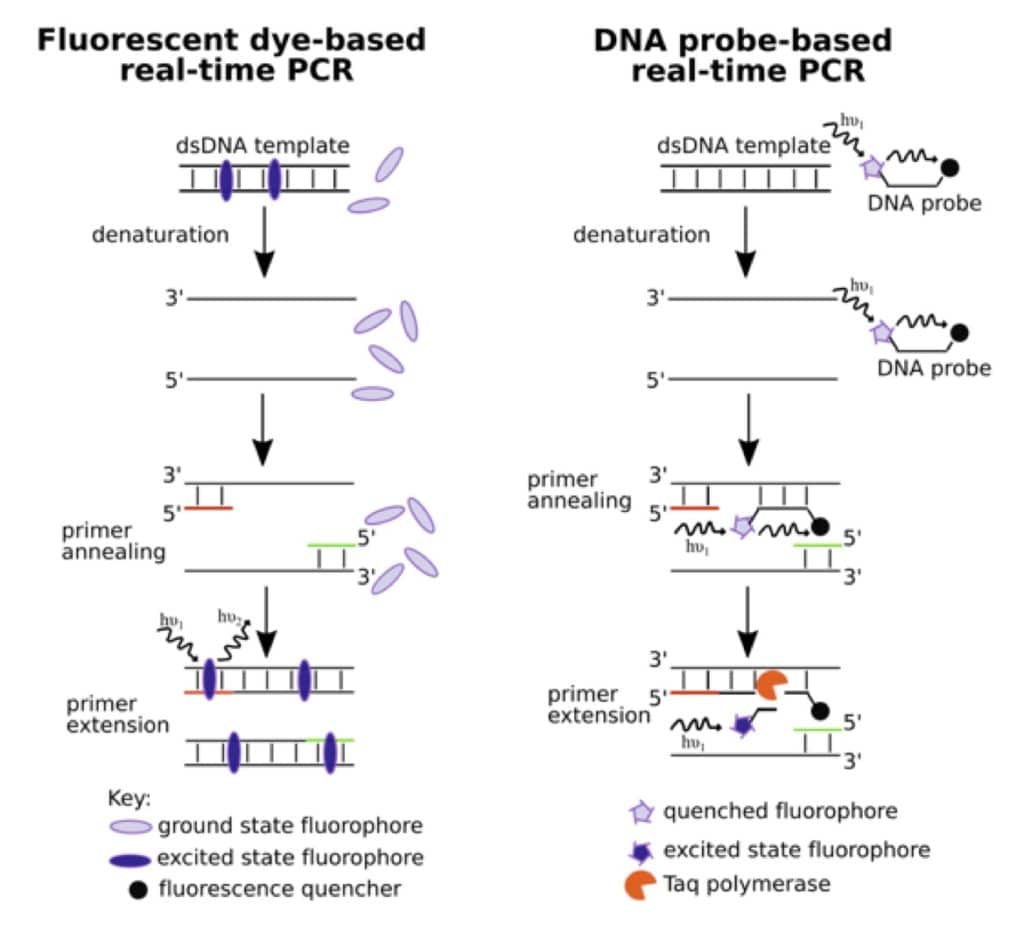
There are two principal methods of DNA quantitation in real-time PCR. These are outlined in the figure below. One uses DNA intercalating or minor groove targeting dyes that show enhanced fluorescence upon binding. With each amplification cycle, as the amount of the template DNA increases, the number of fluorophores bound, and therefore, the intensity of the fluorescent signal, increase. Popular fluorescent intercalating dyes include SYBR® Green I and SYBR® Gold. Their primary advantage is cost, but they are non-specific and bind all dsDNA and not just the target.
The second method uses fluorophore-labeled sequence-specific DNA probes. A variety of chemistries are used for detection. The most popular type uses the 5’-3’ exonuclease activity of Taq polymerase to chew up an oligonucleotide, which has a fluorophore and a quencher at the 5’- and 3’- ends respectively. The exonuclease activity of the polymerase helps separate the fluorophore from the quencher, which results in increased fluorescence. But then, how do you determine the amount of nucleic acid from fluorescence intensities?

From fluorescence signal to DNA/RNA quantitation
The fluorescence intensity is proportional to the amount of the PCR product during the exponential phase of the reaction, and on this relationship rests quantitation in real-time PCR. With each amplification cycle, there is a proportional increase in fluorescent intensity. If you start with more copies of the template, you reach a threshold fluorescent intensity (say 10 times above the baseline signal) in fewer amplification cycles. The number of cycles it takes to get to this intensity threshold is called your target DNA’s Ct value.
You can use the Ct value in one of two ways. One, you can compare it to a standard curve, which is a semi-log plot of the Ct values versus the log of known concentrations for your target DNA. You then interpolate from this plot to determine the absolute copy number of your target DNA or RNA in an unknown sample. Two, co-amplify a housekeeping gene either in the same tube with a multiplex experiment or amplify in a separate experiment. We have already described details about the latter method (called double-delta-Ct analysis).
That is real-time PCR in a nutshell. There are many more tips and tricks on our website. Or are you rushing to pull out that PCR plate?
Further Reading
- Sigma-Aldrich’s qPCR Technical Guide.
- Bonetta L. (2005). Prime time for real-time PCR. Nature Methods 2(4): 305–312.
- Pfaffl MW (2004). Quantification strategies in real-time PCR. In: Bustin SA, editor. A-Z of quantitative PCR,La Jolla, CA: IUL Press; 2004. pp. 87-112.


