
NMR doesn’t get the credit it deserves.
As a structural tool, it definitely plays second fiddle to X-ray crystallography. Not many people seem to know about the different types of information that NMR can provide.
Fortunately, I did my Ph.D. research in a Nuclear Magnetic Resonance (NMR) lab. So, I can give you all the juicy information about wrestling critical structural data from macromolecules (that’s protein, RNA, and DNA) using NMR.
This article is the first of a three-part series in which I’ll detail quick and easy NMR experiments.
Choose a free resource to help you move forward
DIGITAL TOOL
The GC Setup Helper Pack
DOWNLOAD
Blood Collection Tube Chart
In this part, we’ll discuss a cheap and label-free method of investigating protein folding by NMR.
In parts two and three, we’ll look at using NMR to study protein dimerization and see how multidimensional NMR can identify ligand binding sites.
And I’m going to mainly focus on protein NMR because that’s what I’m most familiar with and because DNA and RNA NMR can be tricky due to signal overlap.
What Is NMR?
Let’s not take it for granted that everybody knows what NMR is.
It stands for Nuclear Magnetic Resonance.
Remember from your chemistry lessons that atomic nuclei contain protons and neutrons? Atoms belonging to the lighter elements (up to and including 40Ca) possess an equal number of protons and neutrons in their nuclei.
Most elements have special forms called isotopes. These have additional neutrons.
In such cases when an element has an odd number of neutrons (and/or protons), it has non-zero nuclear spin.
When such nuclei are exposed to an external magnetic field, they exhibit phenomena that are diagnostic of their immediate chemical environments such as connectivity and valence.
In short—their structure.
One such phenomenon is resonance. Hence the name and abbreviation.
Disadvantages of NMR
Many people feel NMR isn’t worth the trouble because for several reasons.
Isotopic Labelling
You must isotopically label your molecule to impart nonzero nuclear spin. Isotopes used include:
- 15N.
- 13C.
- 2H.
Note that 2H corresponds to deuterium. It doesn’t have a non-zero nuclear spin and is NMR-inactive/NMR-silent.
1H is box-standard hydrogen. It is very much NMR-active because its nucleus is a single, lonely proton. And proteins contain a lot of hydrogen atoms that are all NMR-active. This can lead to massive signal broadening and tarnishing of NMR spectra.
So, deuterium is used in a different fashion to 15N and 13C. It’s used to remove noise rather than impart signal.
Isotopically labeling a protein involves growing the host bacteria in yeast media or minimal media. These media allow you to control the nitrogen, carbon, or hydrogen sources.
For completion, the usual respective sources of the above-mentioned isotopes are:
- 15NH4Cl.
- 13C-glucose.
- D2O (heavy water).
And the D2O replaces H2O when it’s used.
Inferior Growth
Often the bacteria or yeast don’t grow as well in this media because it isn’t as nutrient-rich. Sometimes labeling a molecule isn’t that difficult, but other times it’s nearly impossible.
Expensive Reagents
And isotopic labeling is always going to be more expensive. The reagents listed above can easily set you back a few thousand dollars!
The exact cost obviously depends on the scale on which you intend to prepare your sample. Check out the price of 13C-glucose to get a feel for the costs involved.
Advantages of NMR
So why look at protein folding by NMR? Well, there are some great reasons.
Collecting NMR Spectra Is Quick
One major advantage of NMR is that the spectra can be collected quickly, so you can investigate various buffer conditions and temperatures to see what conditions your protein likes. Ditto for assessing how the stability of your protein changes over time.
Other techniques, like circular dichroism (CD), can give you similar information, but to really show that a protein is well folded by CD, you’d have to collect a melting curve, which usually takes a few hours.
Solution-State Measurements
X-ray crystallography is great, but proteins aren’t crystalline under physiological conditions. (Unless you’re very ill!)
NMR measurements are performed in solution, so you can be confident your results are physiologically relevant.
Plus, you avoid the whole rigmarole of having to crystallize your sample.
NMR Spectrometers Are Common
There’s a good chance your institute contains a suitable NMR spectrometer. Ask the person who looks after it nicely, and you can be collecting data in no time at all.
Not All NMR Experiments Require Isotopic Labelling
While it’s true that most macromolecular NMR experiments are multi-dimensional and require isotopic labeling, there is an NMR experiment you can do to check protein folding by NMR without having to isotopically label your molecule!
We’ll get to it in a moment.
What Are the Sample Requirements for NMR?
Before I go into how NMR can help you, let’s get the deal with the elephant in the room.
NMR is not for everyone.
You generally need about 600 μL of the sample at ~0.5 mM.
You can get away with ~0.1 mM, but we’re talking about ways to make your life easier here, not harder.
Also, smaller molecules are better. If you’re new to NMR, anything larger than about 20 kDa might be pushing the limits. It’s not impossible, but you might have to use some special tricks, and again, this article is all about how NMR can make your life easier.
Estimating Protein Folding by NMR
Have you ever purified a brand new protein and wondered if it was folded?
Or have you ever found a sample in the refrigerator that was months old and debated whether to go ahead and use the questionable sample or spend a week making a new sample?
Well, a quick 1D proton NMR spectrum can help you decide if the protein is folded and, therefore, likely to be functional.
Better yet, it doesn’t require isotopic labeling.
1D proton NMR spectra of proteins can get very complicated very fast. Each peak corresponds to a particular proton in the protein. So that means a protein of 100 amino acids could have roughly 1000 peaks, many of them overlapping.
This is why most NMR experiments done on proteins are multidimensional (2D, 3D, or even 4D). However, a 1D proton spectrum can still provide a quick and dirty way to qualitatively evaluate protein folding.
After setting up your sample, a 1D spectrum usually takes seconds to collect. However, interpreting it can require an experienced eye, so you’ll probably want someone nearby who’s looked at a lot of NMR spectra.
How Does Proton NMR Work?
The basic idea is that if a protein is well folded, the peaks in the 1D NMR spectrum are sharp and narrow and cover a large range of chemical shifts.
If the protein is unfolded or partially folded, the peaks are broader and not as widely dispersed.
A spectrum with good dispersion, i.e., peaks in the negative ppm range and peaks out near 10 ppm, is a good indication of a folded protein.
Take a look at the 1D spectra below in Figure 1.
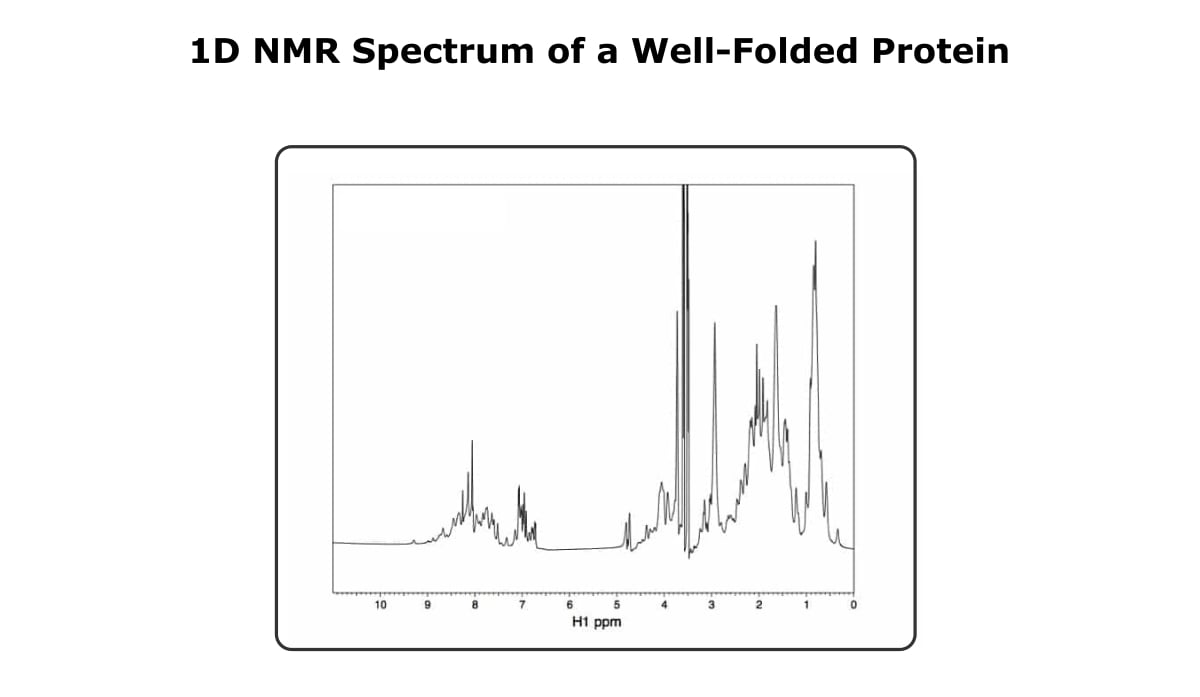
First, you might notice that it kind of looks like a mess, and if you try to gain any information based on a specific peak, you’ve got your work cut out for you. However, if you look at the spectra as a whole, you can see that the peaks are well dispersed, ranging from a little over 9 ppm to almost 0 ppm.
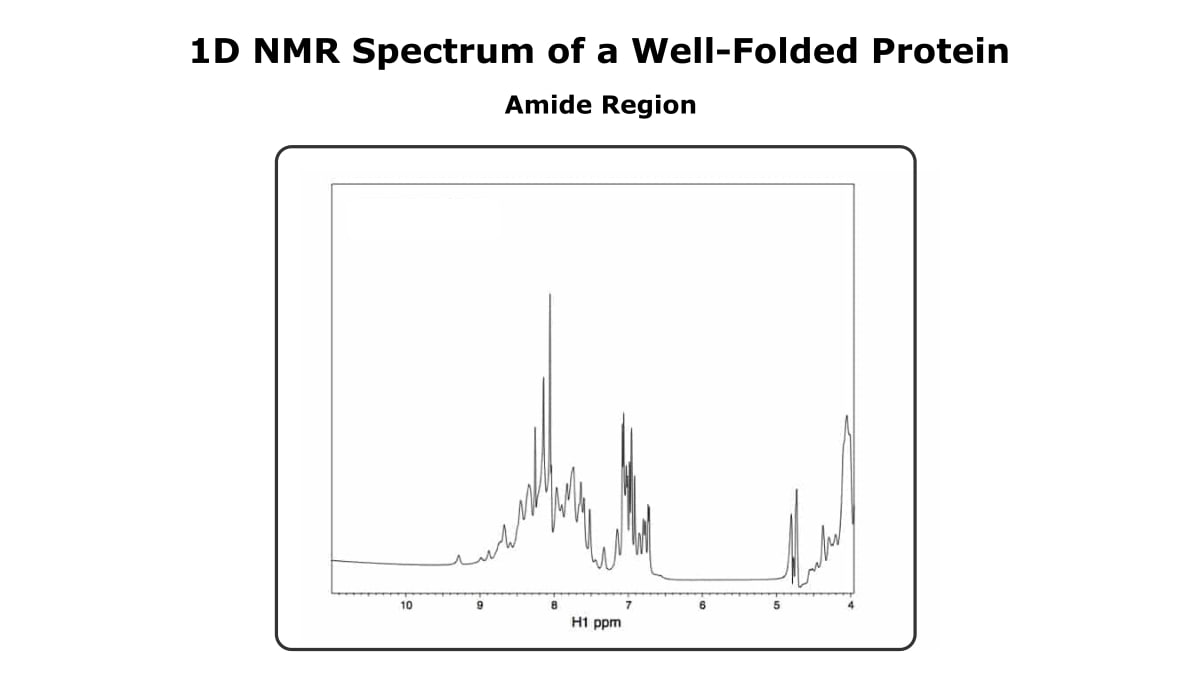
Now, let’s focus on the amide region (7-10 ppm). Figure 2 shows the amide region of the same 1D spectrum we just saw.
And Figure 3 shows the amide region of the same protein, only now it’s unfolded.
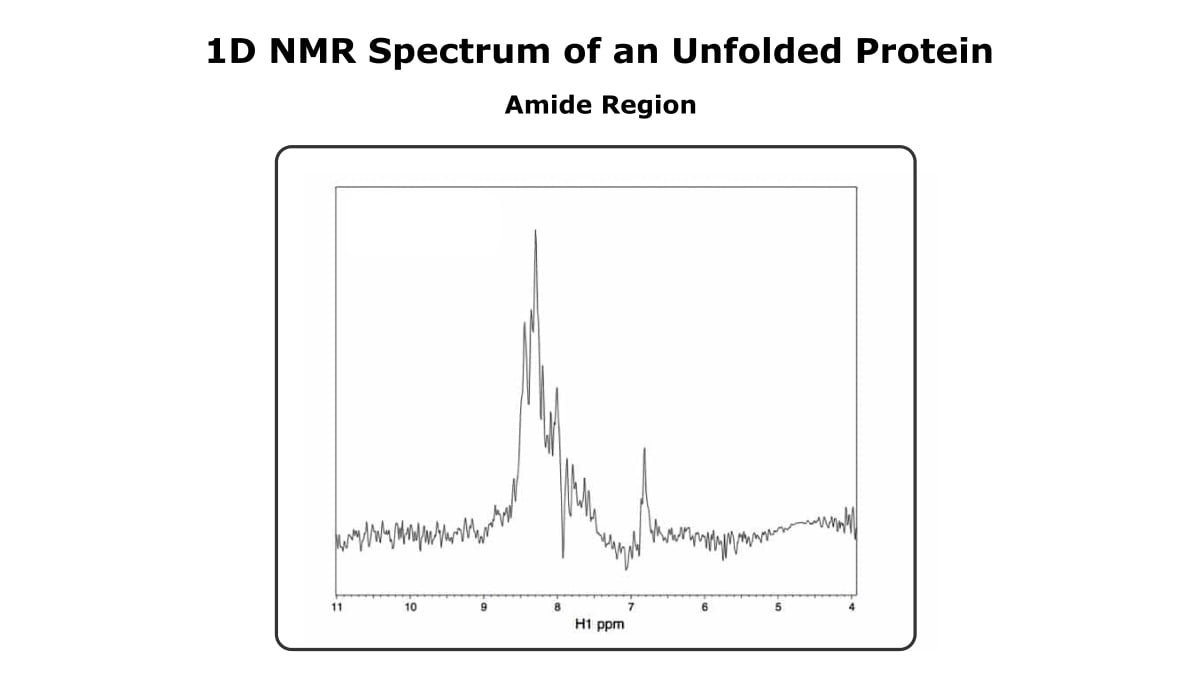
The first thing that probably stands out is that the unfolded spectrum is much noisier. Sorry about that. The difference in sensitivity between the two spectra isn’t because one is folded and one isn’t.
It’s simply because the folded spectrum has more protein than the unfolded one.
Looking past the difference in sensitivity, the spectrum of the folded more has more peaks than the spectrum of the unfolded protein, and the peaks are sharper and more dispersed.
The reason that peaks become broad in an unfolded protein is that a peak’s chemical shift depends on a proton’s environment.
A given proton doesn’t have one discrete environment in an unfolded protein, so the peak is an average of all the different environments in which that proton is found. Also, the environments of different protons aren’t as distinct in an unfolded protein, so the peaks don’t cover a large range of chemical shifts.
In a folded protein, most protons are more constrained in a discrete conformation, and the environment of each proton is very dependent on its position in the tertiary structure of the protein.
Therefore, you get nice, sharp peaks. And the peaks span a broad range of chemical shifts.
The full story is a bit more complicated, but knowing that unfolded proteins result in broad peaks and folded proteins result in narrow peaks can get you a long way. [1]
Additional Considerations for Proton NMR
As I said, this is a rather quick and dirty technique to assess protein folding. And, as you have probably realized, qualitative.
Another thing to watch out for is that peak width can also be affected by how well you set up the spectrometer (I’m talking about shimming for all you NMR enthusiasts out there), so it helps to have an experienced hand with you.
Also, you are going to see all the protons in your sample in your 1D spectrum. While many NMR experiments have ways of reducing the water signal, signals from protons in buffers can be a problem. If you can get away with it, phosphate buffers are best for NMR because phosphate doesn’t have any covalent protons.
However, I’ve found that having 25 mM tris in my buffer doesn’t usually pose a big problem. Sure, you’re going to see peaks from the tris molecules. but if you have a strong enough signal from your protein, you’ll be able to see your protein peaks just fine.
Figure 4 shows a 1D spectra of a protein in a tris-based buffer. The tris peaks dominate the amide region, but the amide peaks of the protein are still visible.
Also, this particular spectrum didn’t do the best job of eliminating the water signal, but as long as you’re looking at the spectrum as a whole, the buffer and water don’t cause too much trouble.
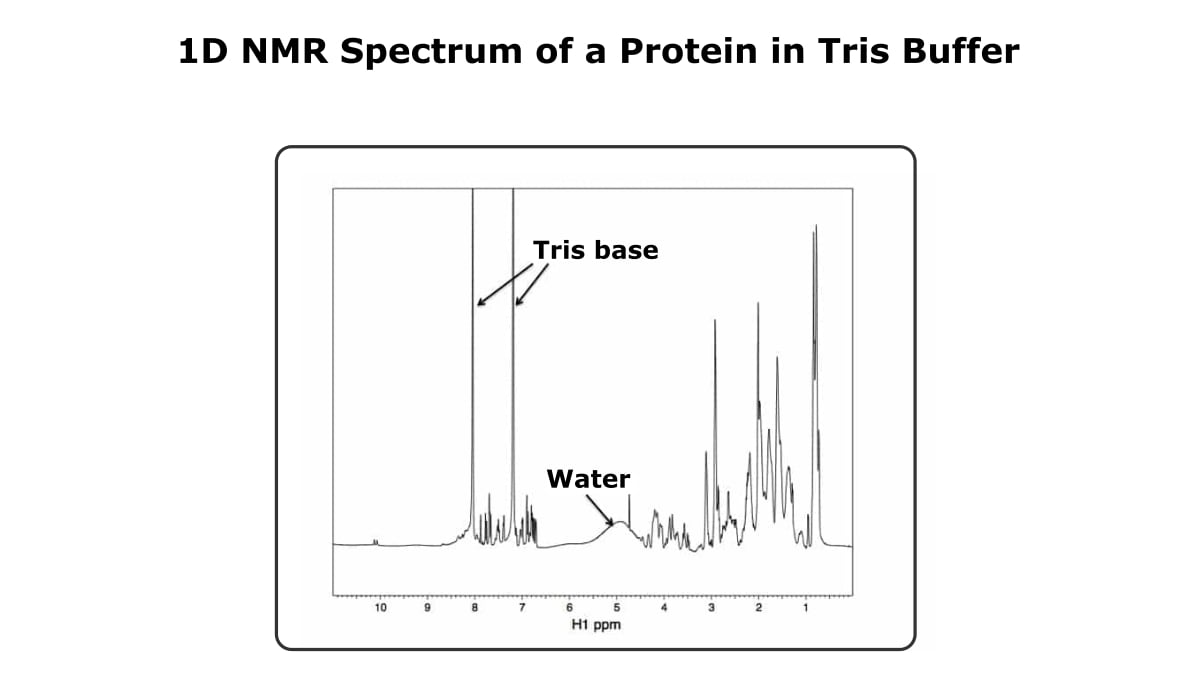
And by the way, this spectrum is of a molten globule protein. The peaks out near 10 ppm are a good indication that the protein at least has some structure, but we found out using CD that this protein likely doesn’t have a unique 3D structure, which is why this technique is qualitative.
Assessing Protein Folding by NMR Summarized
The next time you’re wondering whether your favorite protein is folded, consider talking to your local NMR enthusiast. A quick, label-free 1D proton spectrum can give you the confidence you need that your sample is good to go!
And in this article, you’ve learned rudimental facts to understand what’s going on inside that magical magnet and a simple way to check protein folding by NMR.
Still not convinced that NMR is for you? In the next part of this series, I’ll tell you how a 1D proton NMR spectrum can be used to determine protein dimerization. In the meantime, what techniques do you use to determine whether your protein is well folded? Let us know in the comments below.
Originally published March 2012. Reviewed and republished May 2022.
Reference
Page et al. (2005) NMR screening and crystal quality of bacterially expressed prokaryotic and eukaryotic proteins in a structural genomics pipeline. PNAS 102:1901–5
You made it to the end—nice work! If you’re the kind of scientist who likes figuring things out without wasting half a day on trial and error, you’ll love our newsletter. Get 3 quick reads a week, packed with hard-won lab wisdom. Join FREE here.


