
Drawing is fun but let’s face it; we’re at the age where we can’t really pass off potato print as a valuable use of our time. Still, coloring in molecules is fun, isn’t it? It’s a useful skill too. What’s more, bite-sized articles describing how to easily draw proteins and nucleic acids in PyMOL™ and other molecular visualization tools, are few and far between. There is a wiki that is certainly helpful, but it’s a bit intimidating to the uninitiated.
Let’s go through a simple worked example of how to make some impressive images of a Bitesize Bio color-themed protein–DNA complex. Once you’ve got a handle on the basic syntax, you can then apply what you’ve learned here to draw your own molecules in the future.
Before getting started, download the latest version of PyMOL™ if you don’t already have it installed. You may need to right-click on the installer and “Run as administrator.” Or, if you are following this tutorial from your place of work or study, contact your IT administrator to install the software for you.
Your test molecule is going to be the transcription factor AgrA from methicillin-resistant Staphylococcus aureus (MRSA). [1]
Choose a free resource to help you move forward
DOWNLOAD
Hemocytometer Cell Counting Helper Pack
POSTER
Top 10 Tips for Proper Pipette Care
1. Set the Scene
We first need to load the test molecule into PyMOL™, display its sequence, and remove the water molecules. To do all that, paste the following commands into the PyMOL™ command-line one at a time and hit return after each one:
fetch 3bs1
set seq_view, 1
remove resn hoh
“3bs1” is the PDB ID for AgrA. You can use the “fetch” command with any PDB ID to load the corresponding molecule into PyMOL™. After finishing this article, why not browse the PDB for your favorite molecule, load it into PyMOL™, and try out a few of the tricks you’ve learned.
Notice that there are still two magnesium cations displayed. Let’s remove these too. Scroll the sequence ribbon all the way to the right, and you’ll see two entries labeled “MG”. Click on both of these to highlight them, then paste in:
remove sel
Appending any command with “, sel” or “sel” (the comma is command-dependant) will apply the command to the selected residues only.
Another thing we need to do to get impressive images is to tell PyMOL™ to render items with respect to quality and not performance. To do this, find the ribbon at the top of the screen where it says “File”, “Edit”, and “Build”, etc. Click on the “Display” button, find the “Quality” option in the drop-down menu, and check “Maximum Quality.”
Now that we have removed all the extraneous entities from display, there’s just one more fiddly thing we need to do before we can get on to the fun stuff.
2. Extract the DNA to a Separate Object
PyMOL™ syntax separates molecular entities into “objects.” Some commands can be applied only to entire objects, meaning that it’s impossible to display atoms within the same object differently. This is the case for the various cartoon display modes.
As we want to display our nucleic acid and protein atoms differently, we need to put the DNA residues into their own object. This will allow us to display the nucleic acid differently from the protein.
To extract the DNA residues to their own object, paste in:
extract DNA, resi 1-16
Or highlight all of the DNA residues in the sequence ribbon and paste in:
extract DNA, sel
Either of these extract commands will add the specified residues into their own object called “DNA”, which we can then manipulate independently of the protein residues.
3. On to the Fun Stuff: Coloring in the DNA Backbone
Let’s go for a nice Bitesize Bio color scheme for our molecule. (You can find a full list of colors and their PyMOL™ names here.) Paste in the following commands:
set cartoon_nucleic_acid_color, gray20
cartoon oval, DNA
Notice how only the cartoon corresponding to the DNA changed. This is because appending the command with “, DNA” has told PyMOL™ to apply the change only to the object entitled “DNA” that we created earlier. Carrying on:
set cartoon_nucleic_acid_mode, 4
set cartoon_oval_width, 0.5, DNA
set cartoon_oval_length, 1.4
There are several cartoon nucleic acid modes to choose from. Altering the value from 1 will toggle through these. Try a few until you find one that suits your preference.
4. …And the Nucleobases
To get the nucleobases looking good, paste in the following commands:
set cartoon_ring_mode, 1
set cartoon_ring_color, tv_orange
set cartoon_ring_width, 0.5
set cartoon_ring_transparency, 1
set cartoon_ladder_color, tv_orange
Once again, there are several ring modes to choose from, and altering the value from 1 will toggle through these. Have a play until you find your favorite.
5. Make the Protein Look Nice
Don’t neglect the amino acids. There are loads of ways you can display these, but you can get a long way with just a little by pasting in the following commands:
color limon, resi 136-238
set cartoon_fancy_helices, 1
set cartoon_flat_sheets, off
Note: if you want to color only specific residues rather than the whole protein, use the sequence ribbon and highlight only the residues you want to color, and then paste in:
color limon, sel
6. Applying the Final Touches
You don’t want your nice image spoiled by jagged edges and complicated shadows. Paste in the following commands to neaten up your image:
set ray_trace_mode, 3
bg_color white
set ray_shadows, off
set antialias, 2
Note: PyMOL™ currently has four ray trace modes, and you can switch between these by setting the ray_trace_mode value anywhere between 0 and 3. My personal favorite is 3.
Orientate the molecule as you desire, and rotate the mouse scroll wheel away from you to widen the visible slab (that is, render all of the atoms regardless of how far back into the distance they are—you’ll see what I mean when you do it).
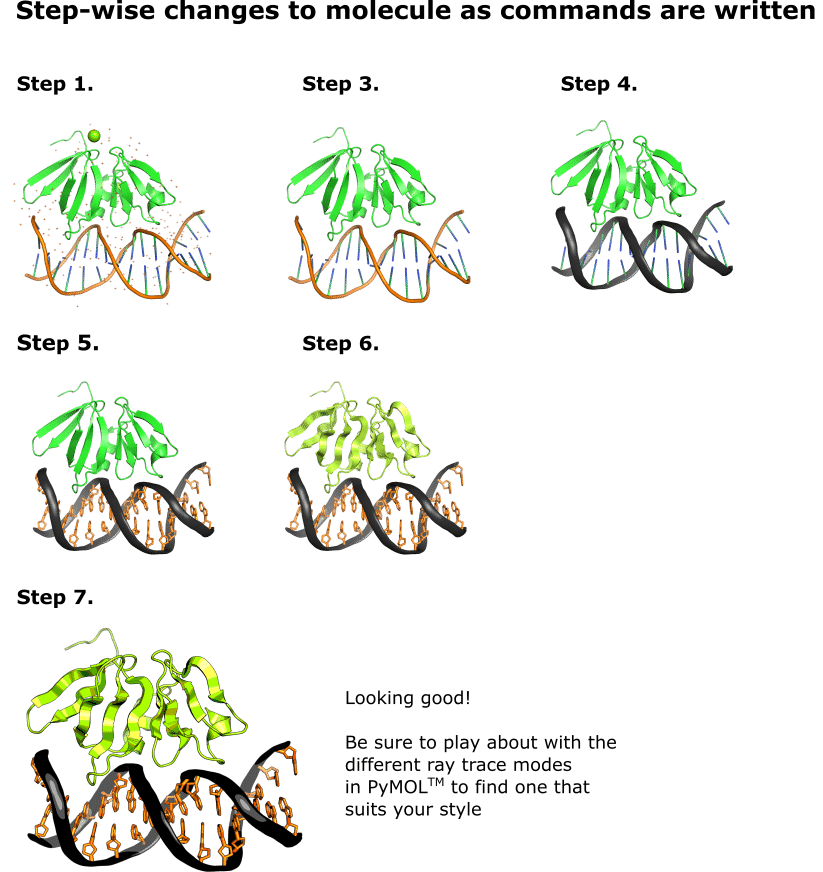
7. Render your Masterpiece!
Finally, paste in the following command to render a high-quality .png image of your molecule to the desktop:
png ~\desktop\MyImage1, width=12cm, dpi=600, ray=1
Note: rendering these images is computationally intensive, and the PyMOL™ window will probably stop responding as it draws the image to your desktop. Don’t click anywhere in the PyMOL™ window while the image is being drawn—the program will eventually start responding again. I promise.
If you don’t have permission to render an image to the desktop, try rendering it to your “Documents” folder instead by pasting in:
png C:\users\your_username\documents\MyImage1, width=12cm, dpi=600, ray=1
Where “your_username” is the name of the account you’re signed in to verbatim. So, for me, that would be:
png C:\users\warwick\documents\MyImage1, width=12cm, dpi=600, ray=1
If it’s gone well, you should have an image looking something like the one in step 7 of Figure 1.
If, on the other hand, your view of the molecule has gone a bit funny and you need to reset it paste in:
reset
And then left-click and drag anywhere in the PyMOL™ window to turn the molecule around.
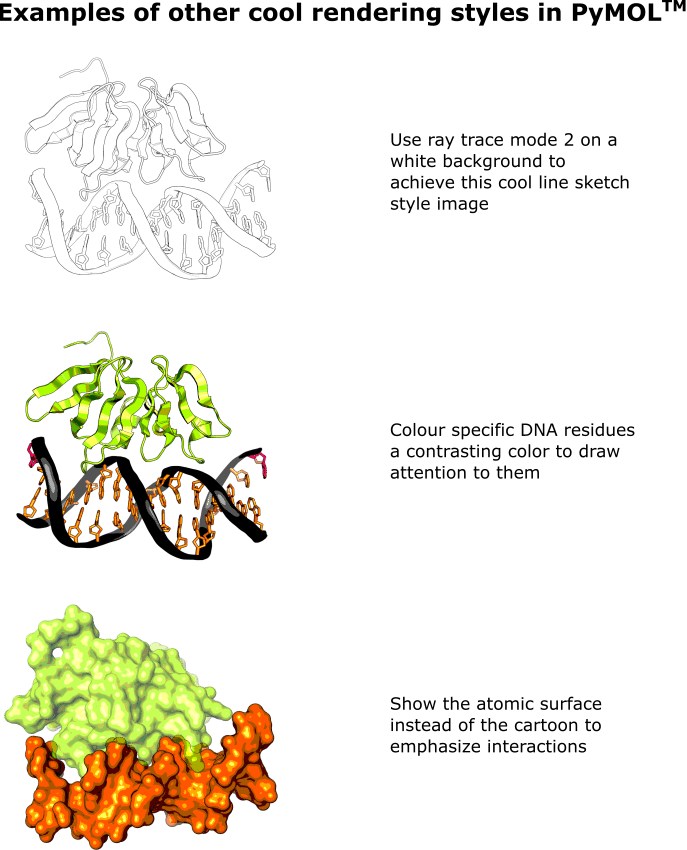
8. Other Cool Rendering Modes
For a nice line sketch feel, paste in:
set ray_trace_mode, 2
png ~\desktop\MyImage2, width=12cm, dpi=600, ray=2
Maybe you could create your own coloring book?
To color specific DNA residues, paste in:
set cartoon_ring_color, hotpink, resi 1,16
set cartoon_ladder_color, hotpink, resi 1,16
set ray_trace_mode, 3
png ~\desktop\MyImage3, width=12cm, dpi=600, ray=1
When you start making images of your own molecule, you can use the sequence ribbon to select whichever DNA residues you want to highlight, and then paste in the following commands to highlight them:
set cartoon_ring_color, hotpink, sel
set cartoon_ladder_color, hotpink, sel
For a more blobby feel, paste in:
show surface, DNA
hide cartoon, DNA
set surface_color, orange, DNA
show surface, 3bs1
hide cartoon, 3bs1
set transparency, 0.3, 3bs1
png ~\desktop\MyImage4, width=12cm, dpi=600, ray=1
Note: this one will take a few minutes to render, so press return only if you have the time!
Check out Figure 2 for examples of how the target molecule looks after these commands have been applied.
Why Use One Molecular Visualization Tool When You Can Use Three?
Kirk or Picard? Daleks or the Cybermen? PyMOL™ or…? Other graphics packages, such as UCSF Chimera, and CCP4MG also enable you to make stunning images. Each one lets you interrogate and display molecules in slightly different ways—PyMOL™ is just my personal favorite. However, please have a play around in all of them to find what works best for you.
This is Just the Beginning
Hopefully, this brief tutorial has equipped you with a few basic commands to start drawing molecules in PyMOL™. Once you get the hang of the syntax, you can create some awesome images. There are literally thousands of combinations of commands to achieve all sorts of quirky and pretty outcomes. Be sure to leave your favorites in the comments section below.
Finally, check out some of our related articles, providing some handy ChemDraw features for chemists and biologists alike and useful tips and tricks for creating attractive and informative figures for your publications.
References
- Sidote DJ et al. (2008) Structure of the Staphylococcus aureus AgrA LytTR domain bound to DNA reveals a beta fold with an unusual mode of binding. Structure 16:727–35
You made it to the end—nice work! If you’re the kind of scientist who likes figuring things out without wasting half a day on trial and error, you’ll love our newsletter. Get 3 quick reads a week, packed with hard-won lab wisdom. Join FREE here.


