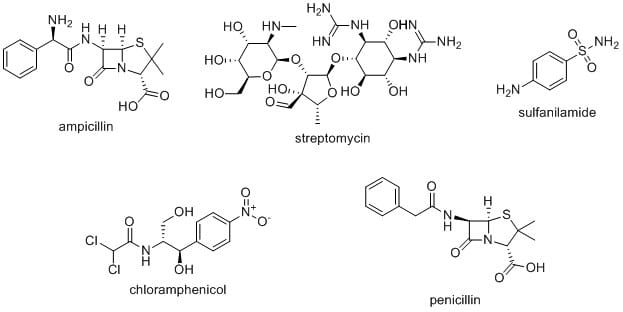
Have you ever wondered how to make professional, easy-to-understand figures of molecules for presentations or publications? While several programs exist for this purpose, ChemDraw is like the Swiss Army knife of chemical sketching programs that most chemists and journals use to prepare figures.
Beyond the ability to create chemically accurate and legible figures, ChemDraw can perform in-depth analyses of compounds and predict their properties. In this article, I’ll highlight some handy ChemDraw features for chemists and biologists alike.
What Exactly IS ChemDraw?
At its core, ChemDraw is a drawing program that allows users to sketch skeletal structures of chemical compounds, which can then be moved into other programs, like MS Word, Powerpoint, and Adobe Illustrator. It’s easy to create figures that appeal to broad audiences with ChemDraw, whether they include your PI, seminar attendees, or the general public. It’s especially useful for making publication-worthy figures because you can easily manipulate minute details of chemical structures and formulas, as well as draw a viewer’s eye to what is really important.
Most universities and several companies have a ChemDraw license and free trials are also available.
Making Beautiful Figures with ChemDraw
ChemDraw is quite intuitive for new users. If you understand skeletal formulas, you can use ChemDraw! The program includes a plethora of customizable options, like setting bond lengths and widths, changing the font and size of individual atoms, and changing the colors of atoms and bonds. You can include stereochemistry and rotate molecules in all axes. Molecular charges, atomic orbitals, and individual electrons are also included.
ChemDraw isn’t limited to drawing chemical structures. Certain versions include customizable bio-art ranging from enzymes and receptors to cartoons of entire organisms and bench equipment. You can use these templates in combination with chemical structures and reaction schemes to show how an experiment is performed or how a compound fits into an overall experiment. If you use thin layer chromatography, there’s even a tool to create TLC plate images.

Now that we’ve covered making structures and figures, let’s dive into the multitude of other exciting things you can do with ChemDraw!
6 ChemDraw Tools to Make Your Day Easier
1. Clean Up Structure
This is one of my favorite drawing tools. After I’m done drawing a particularly complex molecule, the bonds often end up with weird angles and varying lengths. Clean Up Structure adjusts bond angles and lengths so that they are consistent and legible. It is important to note that this tool is not perfect and sometimes has trouble cleaning up complex and multi-ringed structures. Starting off with a structure that is somewhat close to the way you want it to look can help.

2. Convert Name to Structure and Structure to Name
Have you ever read a paper using a molecular probe titled something like “benzo[g]quinazoline-2,4-(1H,3H)-dione 2?-deoxyriboside” and (after recovering from mental paralysis) wanted to know what that molecule actually looks like? ChemDraw makes it easy to convert compound names to the corresponding structures- simply copy and paste the name into the “Convert Name to Structure” tool. You can also convert structures that you’ve drawn to names. ChemDraw can even take the three-letter abbreviations in a peptide sequence (e.g. ala-glu-gly) and generate a full-length peptide.

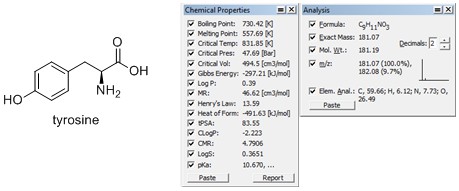
3. Chemical Properties and Analysis:
By selecting these two windows under the “View” tab, you can see analytical information about a selection, including molecular formula, exact mass, free energy, pKa values, predicted boiling point, and lots more! I find the exact mass handy when I’m using a mass spectrometer that won’t cause fragmentation of my molecule of interest.

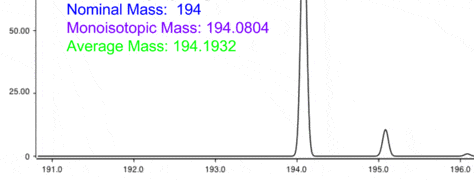
4. Fragmentation analysis
Speaking of mass spectrometry, the Mass Fragmentation tool shows the fragment molecular weights as you select possible fragmentation points. Simply drag the fragmenting tool over the bond you want to break to get exact masses of each fragment.
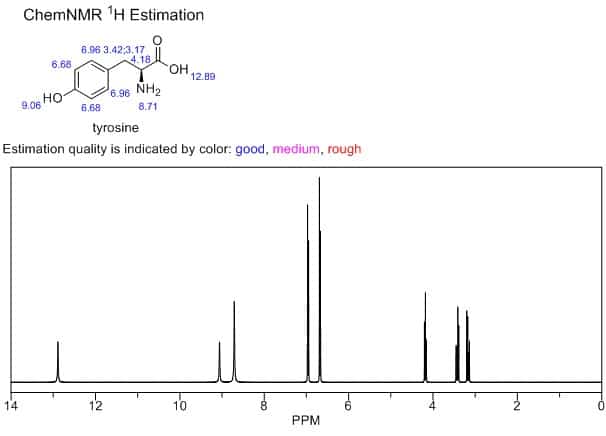
5. NMR Prediction
One of the things I find most valuable is ChemDraw’s NMR prediction tools. I am by no means an expert in analytical chemistry, so I use NMR prediction quite frequently. With a simple click of a button, ChemDraw generates a predicted NMR spectrum with labeled hydrogens (or carbons). It’s important to keep in mind that spectra truly are estimations, and experimental findings may differ. It’s always better to compare to experimentally determined NMR (see #6 below!).
6. Database Searches
Newer versions of ChemDraw have a direct link to SciFinder, which is a powerful addition to this already versatile software. Simply select a structure or reaction and click the SciFinder button. From there, you can explore experimental properties, published literature and patents, and synthesis routes.
Maximizing Your Efficiency in ChemDraw
ChemDraw can be a bit daunting and tricky to use at first, but shortcuts and hotkeys can help. I’m constantly learning new applications and shortcuts for ChemDraw tools. In that sense, it’s a lot like Excel for chemists! Video tutorials are plentiful and they are an excellent way to start seeing what ChemDraw has to offer. In fact, almost everything I’ve learned about ChemDraw is on YouTube. CambridgeSoft also offers webinars and articles, though these are often geared toward experienced chemists who have used ChemDraw before.
While this article is by no means an exhaustive list of ChemDraw’s capabilities, I hope it’s given you an idea of what this software is capable of. There are plenty of tools I’ve never even used that are available! If you’re a hard-core chemist, I highly encourage you to check out the ChemDraw website to learn more.


