
Gas chromatography (GC) is one of the primary separation techniques for volatile and semi-volatile compounds. Whether it’s the right technique for a given analysis depends on the analyte, the matrix, and what you need to measure, but if your compounds can be vaporised without decomposing, GC is a strong starting point. If they can’t, you likely need liquid chromatography (HPLC) instead.
If you are familiar with other chromatography methods, such as HPLC or GPC, then you already know more than you think!
This page is built around what you actually need when you sit down with a GC: which parts do what, how to choose a detector, what the chromatogram is telling you, and where things go wrong in practice.
In this article
- What is gas chromatography?
- Is GC right for your sample?
- How does gas chromatography work?
- GC components: a closer look
- Which detector do you need? (decision tree)
- Choosing a stationary phase
- Packed vs capillary columns
- How to read a gas chromatogram
- GC-MS: adding mass spectrometry
- Troubleshooting: when something goes wrong
- What the protocol doesn’t tell you
- Common mistakes
- Putting it together
What Is Gas Chromatography?
Gas chromatography (GC) is an analytical technique that separates, identifies, and quantifies compounds in the gas phase. The core logic is the same as other chromatography methods: compounds partition between a mobile phase and a stationary phase, and the differing strengths of that interaction drive separation.
Choose a free resource to help you move forward
DIGITAL TOOL
The GC Setup Helper Pack
DOWNLOAD
Blood Collection Tube Chart
Your sample doesn’t have to be a gas at room temperature. The instrument vaporises it for you. After vaporisation, compounds travel through a column, interact with the stationary phase to different extents, and reach the detector at different times. The time a compound takes to reach the detector is called its retention time (tR), the fundamental measurement in GC.
Is Gas Chromatography Right for Your Sample?
Before you start, check that your sample is compatible with gas chromatography. Suitability depends on more than a single cutoff. Volatility, thermal stability, polarity, and matrix all interact.
Volatile or can be vaporised. Your analytes must enter the gas phase without decomposing. Most GC applications cover boiling points from nC3 to nC44, though specialised methods extend beyond this.
Thermally stable. The GC inlet and oven can reach 300 °C or higher. Compounds that degrade at these temperatures produce artefact peaks, not real results.
Molecular weight is a rough guide, not a hard cutoff. Volatility matters more than mass alone. Many low-MW polar or ionic compounds are poor GC candidates, while some higher-MW non-polar compounds work well. As a loose guideline, most GC analytes are below ~1,250 Da.
Not ionic or highly polar without derivatisation. Charged or very polar compounds stick to active sites or don’t vaporise. Derivatisation can solve this in some cases, but HPLC is often the more practical route.
Sufficient concentration (or can be concentrated). Your detector has a lower limit. Know the expected concentration range before choosing your injection method and detector.
If your sample fails the volatility or thermal stability checks, look at HPLC instead. If you need to analyse permanent gases (O₂, N₂, CO₂), GC works well. Use a packed column with a TCD detector.
How Does Gas Chromatography Work?
Your sample is injected into a heated inlet, where it vaporises. The gaseous molecules mix with the carrier gas (the mobile phase), which pushes them into the column. The column is coated with a stationary phase that interacts with your analytes to differing degrees.
Compounds that interact strongly with the stationary phase are “held up” and move slowly. Compounds with weaker interactions travel faster. This differential movement is what separates a mixture into its individual components.
Each compound reaches the detector at a different time. That time is its retention time (tR). The detector records the signal, and a computer plots it as a chromatogram: detector response (y-axis) versus time (x-axis).
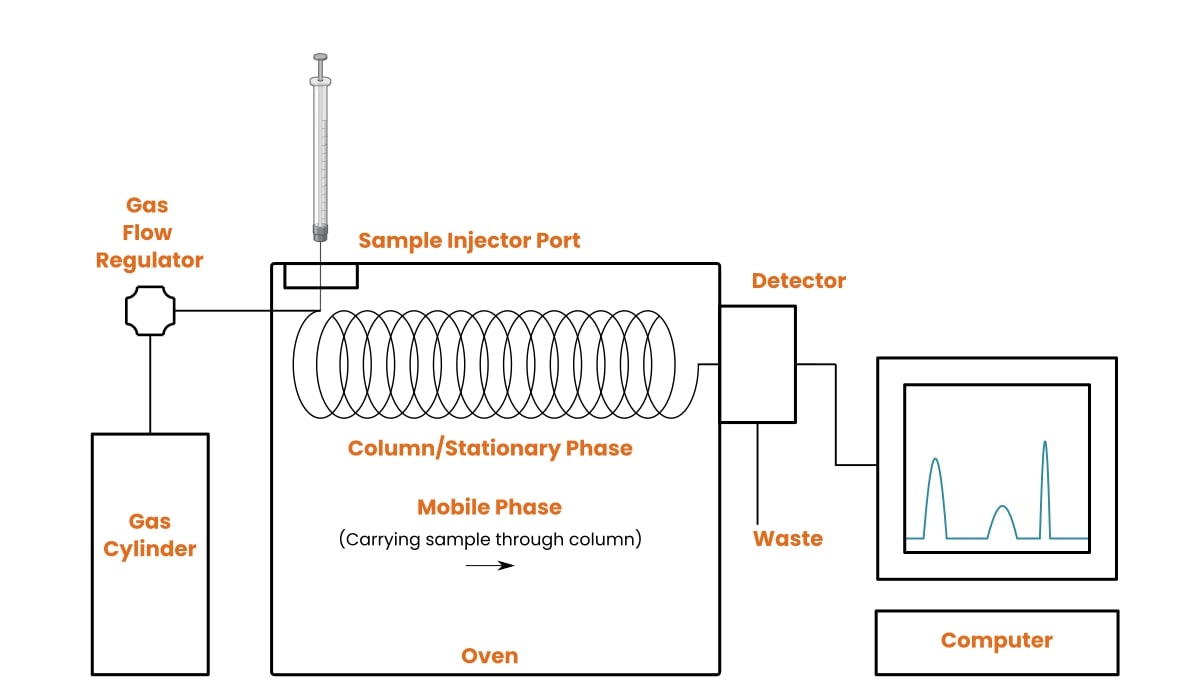
GC Components: A Closer Look
Every gas chromatograph contains five core parts working in sequence. The reference table below summarises what each part does, your options, and the most common issues to watch for.
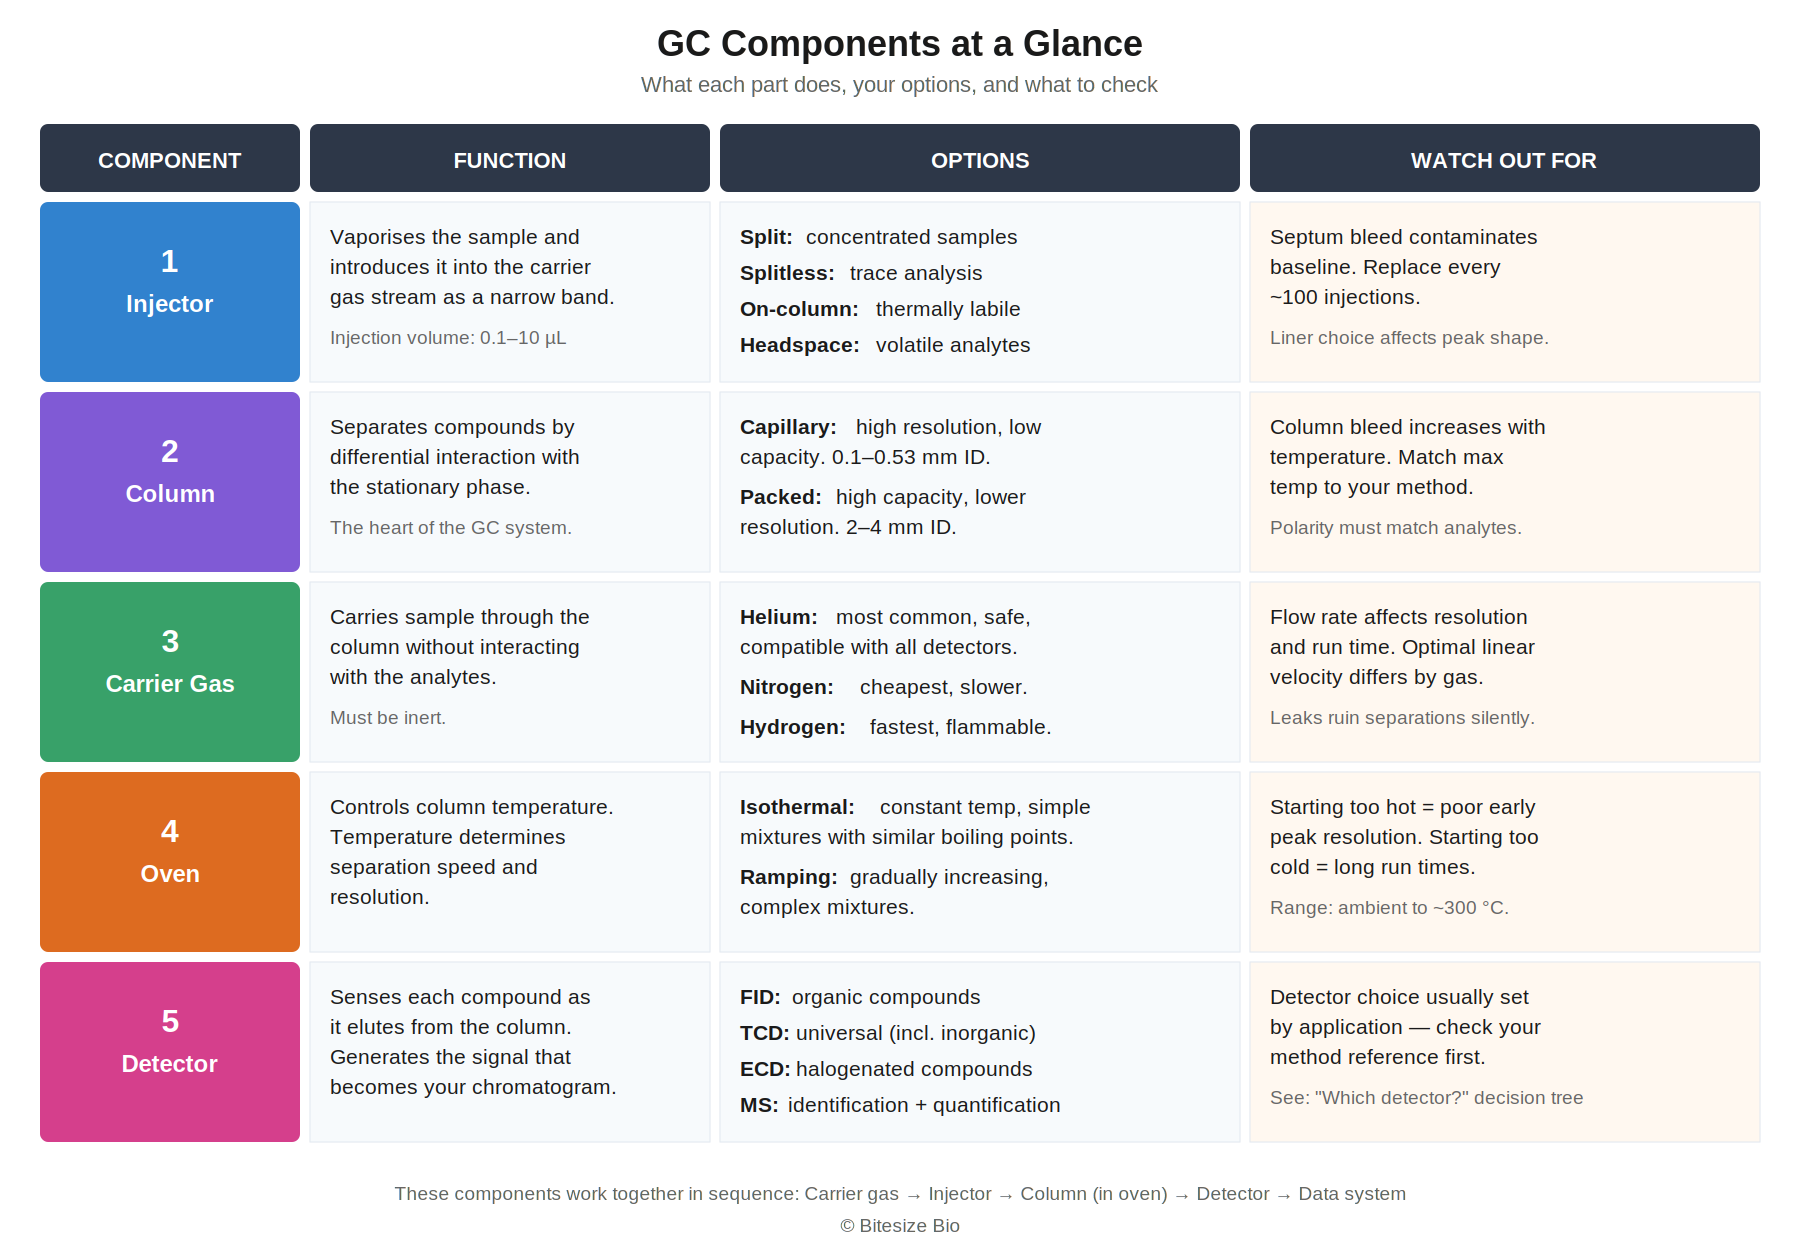
1. Sample Injector
Liquid samples are usually introduced with a liquid microsyringe. Gas samples, such as air or breath, are introduced using a gas sampling valve or a gastight syringe.
Injection mode matters. Split injection discards most of the sample; use it for concentrated samples. Splitless injection puts everything on the column; use it for trace analysis. On-column injection avoids the hot inlet entirely and is best for thermally sensitive analytes.
2. Column / Stationary Phase
The column is a coiled tube (metal or fused silica) with a stationary phase bonded to the inside. Compounds interact with it according to their polarity and volatility, producing the differential retention that separates your mixture. Columns come in two types, packed and capillary, covered in detail below.
3. Carrier Gas
The carrier gas must be inert, carrying your sample without reacting with it. Helium has historically been the most common choice, but periodic shortages and rising costs have driven increasing adoption of hydrogen, which gives the best efficiency and fastest run times but requires safety infrastructure. Nitrogen is the cheapest option but produces slower separations. The detector type usually determines which gas is compatible.
4. Oven
The oven controls column temperature. An isothermal program holds a constant temperature for simple mixtures. A ramping program gradually increases temperature for complex mixtures spanning a wide boiling range. Typical range: ambient to ~300 °C, instrument-dependent.
5. Detector
The detector senses each compound as it elutes and generates the signal that becomes your chromatogram. Different detectors vary in sensitivity, selectivity, and whether they destroy the sample. Choosing the right one is covered next.
Which Detector Do You Need?
Choosing the right detector is one of the first practical decisions in any GC method. The decision tree below gives a first-pass logic. Start here, then refine based on your specific application, matrix, and sensitivity needs.
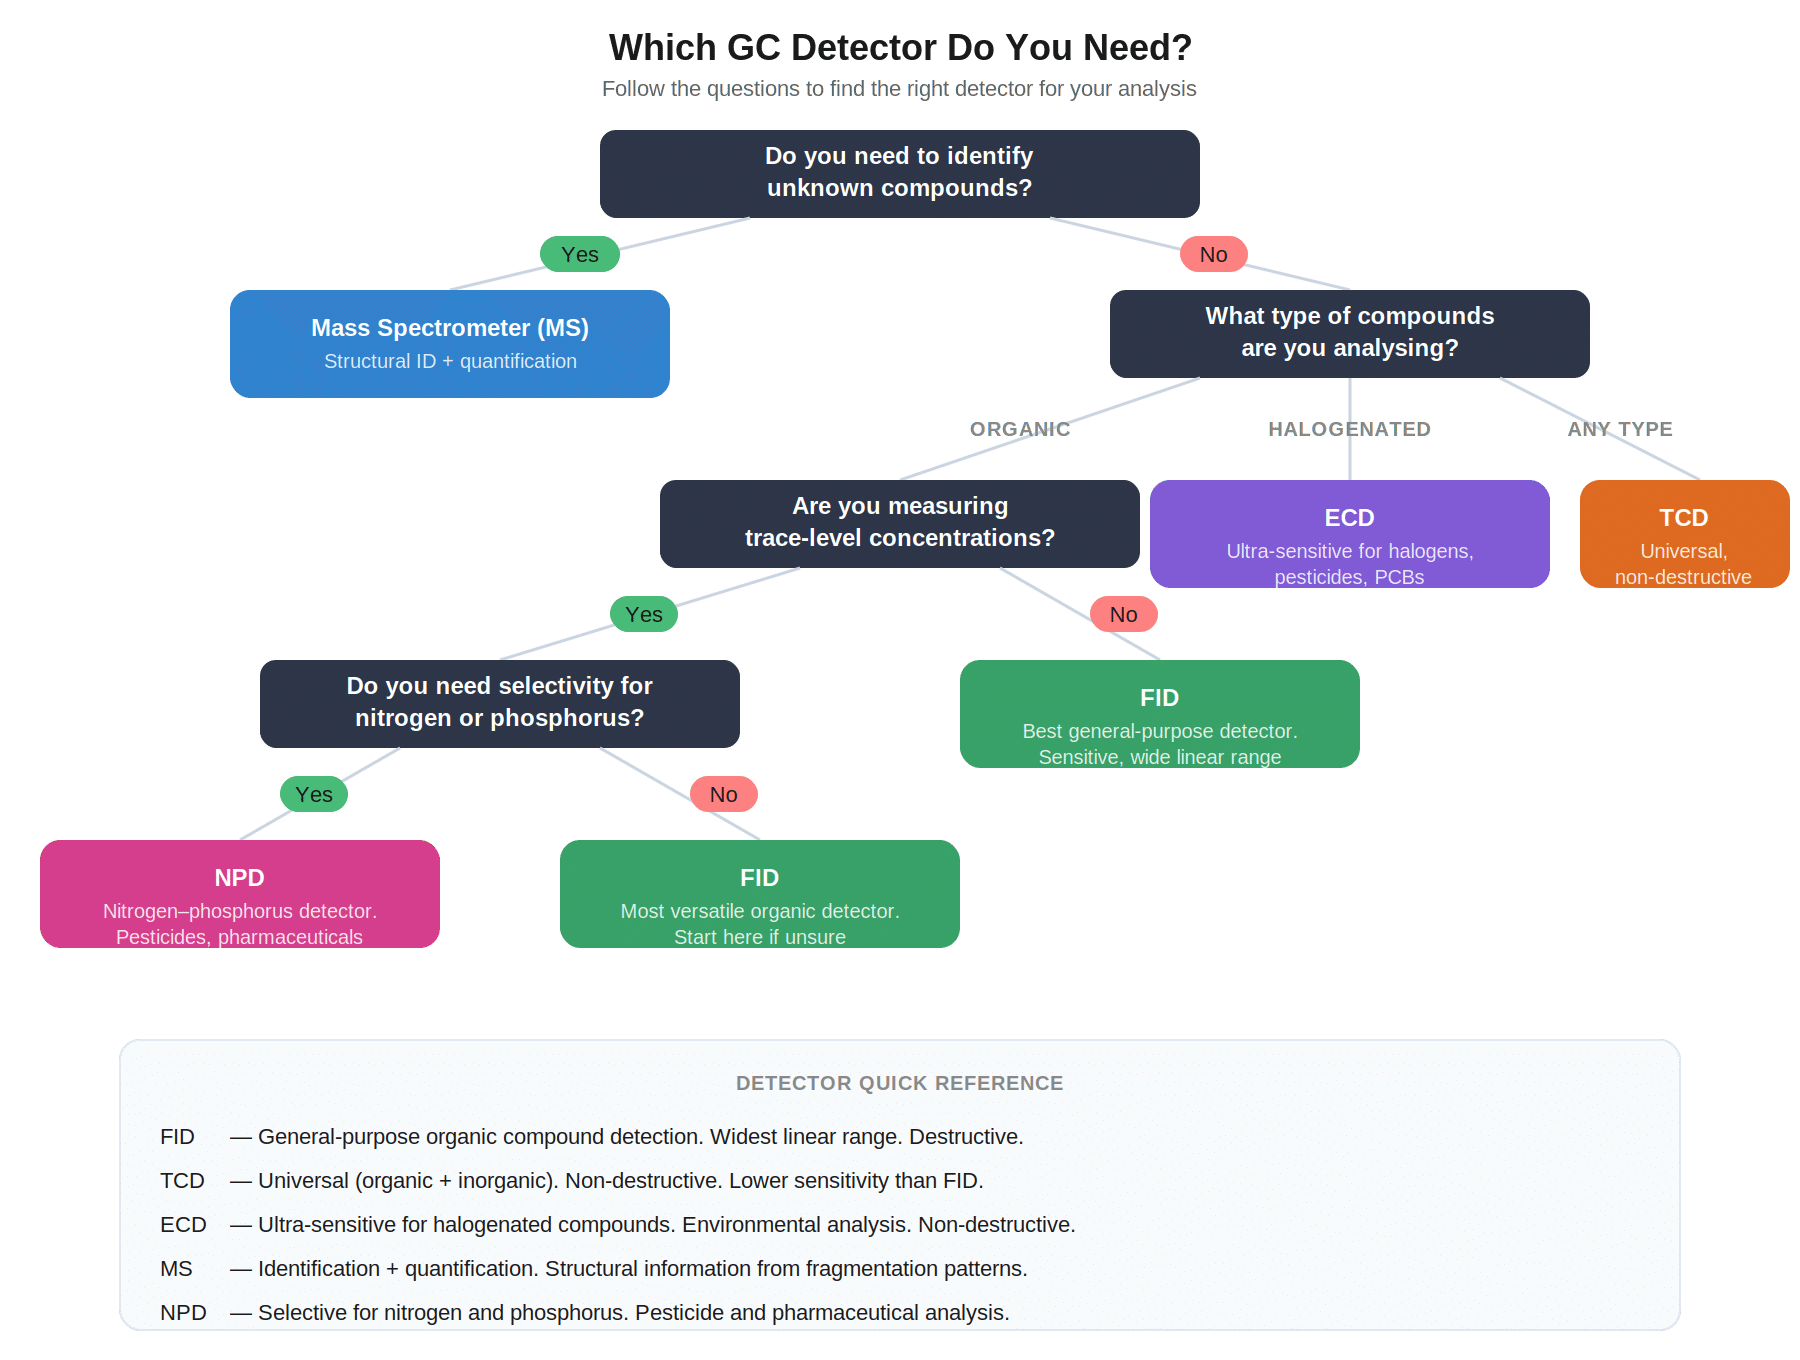
If you’re unsure, start with an FID. It’s the most versatile general-purpose detector for organic compounds, with a wide linear range and straightforward operation. If you need to identify unknowns, not just detect them, you need a mass spectrometer (MS).
A note on TCD: it’s often called a “universal” detector because it responds to any compound that differs in thermal conductivity from the carrier gas. In practice, its sensitivity is substantially lower than FID or ECD, and response varies by analyte. “Universal” means broadly applicable, not equally sensitive to everything.
The decision tree is a first-pass guide, not a complete detector selection matrix. Some applications need detectors beyond the five shown. Sulfur-selective analysis typically uses a flame photometric detector (FPD) or sulfur chemiluminescence detector (SCD). Permanent gas analysis at low concentrations may need a pulsed discharge detector. Trace-level VOCs in environmental matrices often use purge-and-trap or headspace sampling with MS in selected ion monitoring mode. If your application doesn’t fit the tree, consult your method reference before committing to a detector.
Choosing a Stationary Phase
Column type determines resolution and capacity. Stationary phase determines selectivity, meaning which compounds separate from which. Getting this wrong means no amount of method optimisation will resolve your target analytes.
The core principle is like dissolves like. Match the polarity of the stationary phase to the polarity of your analytes.
Phase type | Chemistry | Best for | Common names |
Non-polar | 100% dimethyl-polysiloxane | Hydrocarbons, solvents, general screening. Default starting point. | DB-1, HP-1, Rtx-1, OV-1 |
Low/mid-polar | 5% phenyl dimethyl-polysiloxane | Drugs, pesticides, semi-volatiles. The most widely used phase. | DB-5, HP-5, Rtx-5 |
Mid-polar | 35-50% phenyl or cyanopropyl phases | Analytes needing more selectivity than a 5% phenyl phase provides | DB-17, DB-1701, OV-17 |
Polar | Polyethylene glycol (PEG / WAX) | Alcohols, aldehydes, FAMEs, flavour compounds. | DB-WAX, HP-INNOWAX, Stabilwax |
Specialty | Application-specific (chiral, PLOT, ionic liquid) | Enantiomer separation, permanent gases, very specific applications, | Cyclodex-B, GS-GasPro, SLB-IL60 |
If you don’t have a method to follow, a 5% phenyl column (e.g. DB-5ms) is a common general-purpose starting point. It covers a wide range of applications and is the phase used in most published methods. That said, it is a starting point, not a universal choice. Some analyte classes (FAMEs, polar solvents, chiral compounds) need a different phase from the outset.
Packed vs Capillary Columns
Packed Column | Capillary Column | |
Internal diameter | 2-4 mm | 0.1-0.53 mm |
Length | 1-5 m | 10-150 m |
Sample capacity | High; handles larger volumes | Low; easily overloaded |
Resolution | Lower; fewer theoretical plates | Higher; the standard for most work |
Best for | Permanent gases, preparative work, simple mixtures | Complex mixtures, trace analysis, most routine applications |
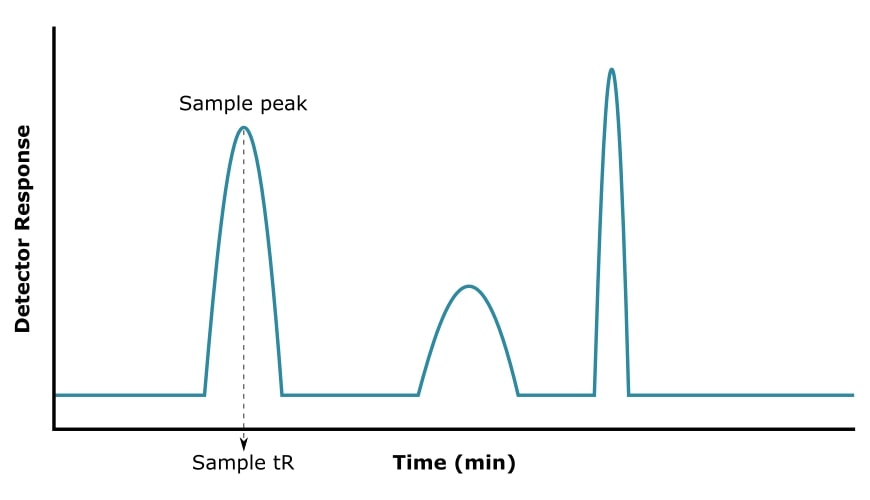
How to Read a Gas Chromatogram
Every GC experiment produces a chromatogram: detector response (y-axis) plotted against retention time (x-axis).
These are procedural errors, not instrument problems. They’re easy to prevent once you know to watch for them.A chromatogram gives you three types of information. Each comes with important caveats.
1. Sample Complexity
Count the peaks to get a minimum estimate of how many compounds are present. Each resolved peak corresponds to at least one compound with a characteristic tR under your specific conditions.
The number of peaks is not the same as the number of compounds. Two compounds with similar properties can co-elute as a single peak. A single compound can produce multiple peaks if it degrades in the inlet or exists as separable isomers. The chromatogram shows you what the column and detector resolved, not the full composition of your sample.
2. Compound Identity
You can tentatively identify a compound by matching its tR to a reference standard run under identical conditions: same column, carrier gas flow rate, temperature program, and instrument. Retention times from other labs or published methods are guides, not confirmations.
For confident identification, GC-MS is far more powerful. The mass spectrum provides structural information that retention time alone cannot. Even with GC-MS, a library match should be confirmed with a reference standard whenever possible, since fragmentation patterns can overlap between structurally similar compounds.
3. Compound Quantity
Peak area is proportional to analyte concentration within the detector’s linear range, for a given compound and method. Different compounds produce different detector responses per unit mass. To convert peak area to actual concentration, you need a calibration curve built with known standards of the same analyte under the same conditions.
Relative amounts between peaks can be compared using peak area ratios, but only if the detector responds equally to both analytes (true for FID with similar compound classes, but not generally true for other detectors).
4. Peak Shape and Baseline
Beyond identity and quantity, the chromatogram tells you whether your system is working properly. Pay attention to these features:
Peak symmetry. A well-behaved peak is roughly Gaussian. Tailing (a drawn-out right side) usually indicates active sites in the inlet or column. Fronting (a steep right side with a drawn-out left) typically means the column is overloaded or there is a poor interaction between the analyte and the stationary phase.
Peak width. Narrower peaks mean better separation efficiency. If your peaks are broader than expected, check your injection technique, starting oven temperature, and carrier gas flow rate. Peaks that broaden over the course of a run are normal in isothermal methods but should not occur with a well-designed temperature program.
Baseline noise. A clean baseline is flat and stable. Excessive noise reduces your ability to detect low-concentration analytes because it lowers the signal-to-noise ratio. Common sources include detector contamination, carrier gas impurities, and electronic interference.
Signal-to-noise ratio (S/N). This is the practical measure of whether a peak is real or artefact. A S/N of 3:1 is generally accepted as the limit of detection; 10:1 is the limit of quantification. If your target peak barely rises above the noise, you need to either concentrate your sample or reduce the baseline noise before you can report a reliable result.
Area vs height. Peak area is generally preferred over peak height for quantification because area is less affected by small changes in chromatographic conditions (flow rate variation, slight temperature differences) that can alter peak shape without changing the total amount of analyte. Height is sometimes used for very narrow, well-resolved peaks where integration is straightforward, but area is the more robust measurement for most work.
GC-MS: Adding Mass Spectrometry
Coupling a gas chromatograph with a mass spectrometer creates one of the most powerful analytical combinations available. GC handles the separation; MS handles the identification. A GC coupled with an MS is known as a GC-MS system. It produces a mass spectrum for each sample component as well as the GC chromatogram.
Compounds elute from the column and enter the mass spectrometer, where they are ionised and fragmented. The resulting mass spectrum acts like a fingerprint for each compound.
What GC-MS gives you that GC alone cannot: structural information about unknowns. With only a GC detector, an unexpected peak remains unidentified. With MS, you can search the fragmentation pattern against spectral libraries (such as NIST) to get a candidate match.
A library match is a starting point, not a confirmation. Fragmentation patterns can be similar between structurally related compounds, and matrix effects can alter apparent spectra. High-confidence identification typically requires a matching retention index, co-injection with a reference standard, and consistent ion ratios.
GC-MS is widely used across environmental analysis, forensic toxicology, food safety testing, and metabolomics, though the specific configurations and complementary techniques vary by subfield and sample type.
Troubleshooting: When Something Goes Wrong
GC is a robust technique, but problems show up in predictable ways. Each common failure produces a chromatogram pattern that can look like a real result. Recognising these patterns saves hours of wasted analysis time.
Symptom: Peaks have a long tail on the right side (“tailing”).
Most likely cause: Active sites on the column or inlet liner are interacting with your analytes. Especially common with polar compounds and amines.
Fix: Replace or deactivate your inlet liner. If the problem persists, trim 10–20 cm from the inlet end of the column, or replace the column.
Symptom: Unexpected peaks appear that don’t match any known analyte (“ghost peaks”).
Most likely cause: Carryover from a previous injection, or column bleed producing breakdown products at high temperatures.
Fix: Run a blank injection. If the peaks appear in the blank, they’re from the system. Lower your maximum oven temperature or replace the septum.
Symptom: Retention times shift between runs.
Most likely cause: Carrier gas flow rate is inconsistent, usually from a leak or a failing pressure regulator.
Fix: Check all fittings with an electronic leak detector. Verify inlet pressure and flow rate settings. Replace the septum if it has been punctured repeatedly.
Symptom: All peaks are broad and poorly resolved, even with a temperature program.
Most likely cause: Column overloading, or starting oven temperature too high for analytes to focus at the column head.
Fix: Reduce injection volume or increase split ratio. Lower the starting oven temperature so analytes condense and focus at the column inlet before separation begins.
Symptom: Baseline rises steadily throughout the run.
Most likely cause: Column bleed. The stationary phase is thermally degrading.
Fix: Check that your maximum oven temperature does not exceed the column’s rated limit. If the column is old or contaminated, replace it.
What the Protocol Doesn’t Tell You
Your septum is a consumable, not a permanent part. Protocols rarely mention septum replacement. With repeated injections, the septum cores and small pieces of silicone fall into the inlet, causing ghost peaks or tailing. How quickly this happens depends on septum type, needle gauge, and injection technique, but many experienced labs replace the septum daily or after a set number of injections. If you’re seeing baseline artefacts that weren’t there last week, check the septum first.
Column conditioning isn’t optional. A new column (or one that has been sitting unused) needs to be conditioned before you run real samples. Heat it gradually to its maximum rated temperature under carrier gas flow, with no detector connection, following the manufacturer’s recommendations for time and ramp rate. Skipping this produces massive baseline noise and ghost peaks on your first real runs.
Leaks are silent destroyers. A small leak at a fitting doesn’t produce an obvious error. It slowly degrades separation quality, shifts retention times, and introduces oxygen that damages the stationary phase over time. Check for leaks any time you change a column, septum, or liner. An electronic leak detector is a relatively inexpensive tool that makes this check fast and reliable.
Your solvent peak tells you more than you think. The shape and size of the solvent peak is a daily diagnostic. A split or broad solvent peak suggests an inlet problem. A solvent peak that changes height between runs suggests inconsistent injection volume or a failing syringe. Pay attention to it. Most people ignore it entirely.
Common Mistakes
Mistake | How to Spot It | How to Prevent It |
Injecting too much sample (overloading the column) | Broad, flat-topped peaks; poor resolution between adjacent peaks | Reduce injection volume or increase split ratio. Start with 1 µL at 1:50 split. |
Using the wrong syringe for the injection mode | Irreproducible peak areas; syringe damage | Match syringe to injection mode. Liquid for liquid, gastight for gas. |
Running above the column’s maximum temperature | Rising baseline, accelerated bleed, shortened column life | Keep max oven temp at least 10°C below the column’s rated maximum. |
Treating retention time matches as compound confirmation | Misidentification, especially with different instruments or conditions | Run your own reference standards. Use GC-MS for unknowns. |
Skipping column conditioning | Massive baseline noise and ghost peaks on the first real run | Condition every new column per manufacturer instructions first. |
Putting It Together
If you take one thing from this page, make it the decision sequence. Before you run a GC method: check sample suitability (volatility, thermal stability), choose your column type (capillary for most work), select your detector (FID for general organics, MS if you need to identify unknowns), and set your temperature program (start low enough for compounds to focus at the column head).
If something looks wrong in your chromatogram, go to the troubleshooting section above before re-running the sample. Most GC problems are systematic. Running the same method again will give you the same bad result.
And if you’re still building your confidence with GC, an electronic leak detector and the habit of checking fittings every time you touch the plumbing will prevent more invisible problems than almost any other single practice.
References
1. McNair, H.M., Miller, J.M. & Snow, N.H. (2019) Basic Gas Chromatography, 3rd edn. Wiley. ISBN 978-1-119-45075-7.
2. Griffith, J.F. et al. (2023) “Hydrogen or Helium Conservation in Gas Chromatography Mass Spectrometry: How We Chose What Was Right for Our Laboratory.” ACS Chemical Health & Safety, 30(4), pp.151–155. DOI: 10.1021/acs.chas.3c00020.
3. NIST/EPA/NIH Mass Spectral Library (2023 edition). National Institute of Standards and Technology. nist.gov/srd/nist-standard-reference-database-1a.
4. Hinshaw, J.V. “GC Troubleshooting.” Regular column in LCGC North America. Wiley. Published monthly; column archive available at chromatographyonline.com/authors/john-hinshaw.
Originally published July 2016. Reviewed and updated Jun 2026.
You made it to the end—nice work! If you’re the kind of scientist who likes figuring things out without wasting half a day on trial and error, you’ll love our newsletter. Get 3 quick reads a week, packed with hard-won lab wisdom. Join FREE here.


