How do you know whether your RNA is good enough for qPCR?
This article explains what RNA quality actually means for RT-qPCR reliability, including the purity thresholds, RIN scores, and assessment methods that determine whether your gene expression data can be trusted.
RNA quality has two dimensions that are often conflated: purity (is this RNA, or RNA mixed with contaminants?) and integrity (is the RNA intact, or has it been degraded?). Both affect RT-qPCR results, but they affect them differently. Contaminants inhibit the reverse transcriptase or the polymerase. Degraded RNA produces incomplete cDNA, which means some transcripts are systematically under-represented. The result is the same — unreliable fold changes — but the diagnosis and fix are different.
Everything here is built around practical thresholds and decision points: what numbers to look for, what they actually mean, and what to do when your RNA doesn’t meet the standard. If you need the hands-on QC protocol itself, the RNA quality control protocol walks through each measurement step by step.
Choose a free resource to help you move forward
DIGITAL TOOL
qPCR Helper Pack
REFERENCE CARD
qPCR Efficiency & Ct Reference Card
Why RNA Quality Matters for qPCR
Gene expression analysis by RT-qPCR measures mRNA abundance by converting RNA to cDNA and amplifying specific targets. Every step in that chain assumes the starting RNA accurately represents the biological state of the sample. When it doesn’t, every downstream number is wrong — not approximately wrong, but systematically biased in ways that cannot be corrected after the fact.
Consider what happens with partially degraded RNA. With oligo-dT priming, cDNA synthesis initiates from the poly(A) tail, so degradation or loss of 5′ regions means those sequences never make it into the cDNA. Short amplicons near the 3′ end will amplify normally, while longer amplicons or those targeting the 5′ region will show artificially late Ct values. With random hexamer priming, cDNA synthesis can initiate throughout the transcript, making it more tolerant of partial degradation — but degraded templates still reduce representation of longer amplicons. Either way, you end up comparing expression levels across genes that were measured at different effective RNA integrity levels, which is not a comparison at all.
RNA quality is the single variable in RT-qPCR that, when wrong, makes every other optimisation step irrelevant. Perfect primers, validated reference genes, and optimised cycling conditions cannot compensate for degraded or contaminated starting material.
This is why the six factors for successful RT place RNA integrity as a non-negotiable prerequisite — and why reverse transcription troubleshooting almost always starts with checking the RNA.
RNA Purity: What the Ratios Tell You
RNA purity refers to how free your extract is from non-RNA contaminants. The two standard spectrophotometric ratios give you different information about different contaminant classes.
The 260/280 Ratio
This measures nucleic acid absorbance relative to protein absorbance. Pure RNA gives a 260/280 ratio of approximately 2.0. Values below 1.8 indicate protein contamination — typically carryover from the extraction. Values significantly above 2.1 are unusual and may indicate buffer interference with the measurement.
The 260/280 ratio alone does not confirm that your RNA is good enough for RT-qPCR. It tells you about one class of contaminant. RNA with a perfect 260/280 can still be heavily contaminated with organic solvents or salts that the ratio doesn’t detect.
The 260/230 Ratio
This is the ratio that catches the contaminants the 260/280 misses. Expected 260/230 values are commonly around 2.0–2.2, though many workflows use >1.7–1.8 as a practical acceptance range. Low values indicate contamination with phenol, guanidine salts, ethanol, EDTA, or carbohydrates. These are the contaminants that directly inhibit reverse transcriptase and downstream PCR enzymes.
Guanidine contamination from column-based extraction kits is a common cause of low 260/230 and can strongly inhibit RT. If your 260/230 is below 1.5, strongly consider re-purification before proceeding to reverse transcription, especially if RT efficiency is critical or sample input is limited. Acid phenol chloroform extraction methods can carry over phenol residue that produces similar ratio abnormalities — if you’re using TRIzol or similar acid phenol chloroform RNA extraction protocols, an extra ethanol wash or a cleanup column is often necessary.
| 260/280 ratio | 1.8–2.1 | <1.8 | Protein carryover | Enzyme inhibition (mild) |
| 260/230 ratio | ≥1.8 (ideal 2.0–2.2) | <1.7 | Guanidine salts, phenol, ethanol | RT inhibition (severe); PCR inhibition |
| 260/230 ratio | ≥1.8 (ideal 2.0–2.2) | <1.0 | Heavy guanidine or phenol carryover | High risk of RT failure; re-purify before use |
RNA Integrity: Beyond Purity
Even perfectly pure RNA can be useless if the molecules themselves are degraded. RNA is inherently unstable — it is chemically more labile than DNA and extremely susceptible to RNase degradation. Integrity refers to whether the RNA molecules are full-length or fragmented.
Total RNA extracts contain ribosomal RNA (28S and 18S rRNA), mRNA, tRNA, and small RNAs. For gene expression analysis by RT-qPCR, mRNA is the target. Intact eukaryotic total RNA shows a characteristic pattern: sharp 28S and 18S rRNA bands on a gel, with the 28S band approximately twice as intense as the 18S band. Degraded RNA shows a smear that shifts toward lower molecular weights as degradation progresses.
The practical consequence for RT-qPCR depends on your priming strategy. With oligo-dT priming, damaged poly(A) tails mean those transcripts are missed entirely. Random hexamer priming is more tolerant because it initiates throughout the transcript, but degraded templates still produce shorter cDNA fragments. Either way, degraded RNA introduces a systematic bias toward 3′ sequences and against longer or less abundant transcripts.
Factors that compromise RNA integrity
The main threats to RNA integrity fall into a few categories, most of which are controllable with planning and consistent technique. RNase contamination from ungloved hands, non-sterile plasticware, or contaminated reagents is the most common. Extended extraction times — particularly when processing too many samples simultaneously — allow endogenous RNases to act on the RNA before they are inactivated. Incorrect storage (freezer temperature fluctuations, repeated freeze-thaw cycles) degrades RNA progressively. And the source tissue itself matters: RNA from tissues with high RNase content (e.g., pancreas, spleen) degrades faster during extraction than RNA from cell culture.
RIN Scores: What the Numbers Mean
The RNA Integrity Number (RIN) was developed to replace subjective visual assessment of gel images with an automated, standardized metric. The algorithm, developed by Schroeder and colleagues, analyses the full electropherogram trace from an Agilent Bioanalyzer and assigns a score from 1 (completely degraded) to 10 (fully intact). It uses features across the entire trace — not just the 28S/18S ratio — making it more reliable than manual gel interpretation.
RIN thresholds by application
There is no single RIN cutoff that applies to all experiments. The minimum acceptable RIN depends on your downstream application, amplicon length, and the level of technical variability you can tolerate. The table below gives practical thresholds based on published guidelines and widely adopted practice.
| RT-qPCR (short amplicons, <150 bp) | 5 | ≥7 | Short amplicons tolerate moderate degradation; Ct shift may still occur |
| RT-qPCR (longer amplicons, >300 bp) | 7 | ≥8 | Longer amplicons require more intact template for reliable priming |
| Microarray | 7 | ≥8 | 3′ bias increases with degradation; affects probe hybridisation |
| RNA-seq (standard library prep) | 7 | ≥8 | The fragmentation step assumes intact input; degraded RNA shifts the size distribution |
| RNA-seq (FFPE/degraded samples) | Use DV200 | DV200 ≥30% (Illumina enrichment) | RIN is unreliable for FFPE; DV200 measures fragment size distribution. Threshold varies by library-prep workflow |
| Northern blot / cDNA library | 8 | ≥9 | Requires long intact fragments (>1 kb); very sensitive to degradation |
These are practical starting points, not universal acceptance criteria. Validate thresholds against your amplicon length, tissue type, assay design, and acceptable Ct variability.
When RIN doesn’t apply: the DV200 metric
For formalin-fixed paraffin-embedded (FFPE) samples, the RIN is not a useful metric. FFPE-extracted RNA lacks the ribosomal peaks that the RIN algorithm relies on, so the score is meaningless — typically returning values of 2–3 regardless of how well the extraction was performed. The DV200 metric was developed specifically for this situation. DV200 measures the percentage of RNA fragments longer than 200 nucleotides, giving a direct assessment of how much usable template is present. For FFPE RNA-seq and library-prep workflows, DV200 is usually more informative than RIN; in Illumina RNA-enrichment workflows, DV200 below 30% is not recommended. For RT-qPCR from FFPE material, the acceptable DV200 depends on amplicon length, target abundance, and assay validation — shorter amplicons tolerate more degradation.
Assessment Methods: Which One When
Three methods dominate RNA quality assessment. Each answers a different question, requires different equipment, and consumes different amounts of sample. The choice depends on what information you need, how much RNA you have, and what instruments are available.
Spectrophotometry (NanoDrop)
The NanoDrop measures RNA concentration via absorbance at 260 nm and provides the 260/280 and 260/230 purity ratios. It requires only 1–2 µL of sample and takes seconds per measurement. Use it for: routine concentration measurement, screening for gross contamination, and quick purity checks between extraction batches.
Limitations: the NanoDrop cannot distinguish intact RNA from degraded RNA — a fully degraded sample still absorbs at 260 nm. It also cannot distinguish RNA from DNA, so genomic DNA contamination inflates the apparent RNA concentration. It measures total nucleic acid absorbance, not RNA specifically.
Gel electrophoresis
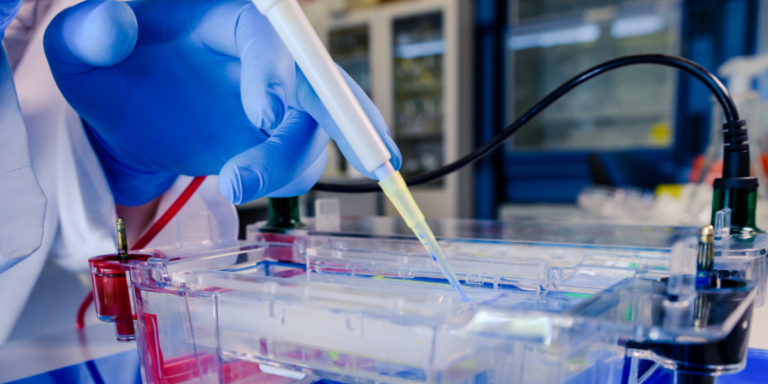
Running 1–2 µg of total RNA on a 1% agarose gel stained with SYBR Green or ethidium bromide provides a direct visual assessment of RNA integrity. For eukaryotic total RNA, intact samples show sharp 28S and 18S rRNA bands with a 28S:18S intensity ratio of approximately 2:1. Smearing indicates degradation; low-molecular-weight smearing indicates severe degradation.
Limitations: gel electrophoresis is qualitative, not quantitative. It requires relatively large amounts of RNA (1–2 µg), is low-throughput, and cannot detect contaminants or assign a numerical integrity score. You also won’t see distinct mRNA bands — mRNA makes up only 1–5% of total RNA and appears as a diffuse smear between roughly 0.5 and 4 kb.
Bioanalyzer / TapeStation
Microfluidic electrophoresis platforms (Agilent Bioanalyzer, TapeStation, or the PerkinElmer LabChip) provide both integrity assessment and concentration measurement from as little as 200 pg of total RNA. The Bioanalyzer generates a full electropherogram trace and calculates the RIN automatically. These platforms are the gold standard for RNA quality assessment when quantitative integrity data is required.
Limitations: instrument cost and per-sample reagent costs are significant. Not every lab has access. For routine qPCR work where you are confident in your extraction protocol, a NanoDrop check plus occasional gel verification may be sufficient.
Which method should you use?
| Routine extraction from a validated protocol | NanoDrop | Concentration + purity ratios; confirm nothing has changed |
| New tissue type, new extraction kit, or troubleshooting | NanoDrop + gel | Purity ratios + visual integrity check |
| Publication-quality data or high-value samples | Bioanalyzer / TapeStation | RIN score + concentration + full electropherogram |
| FFPE or archival samples | Bioanalyzer with DV200 | DV200 fragment distribution; RIN is not informative |
| Limited RNA (<500 pg) | Bioanalyzer Pico Kit | Integrity + concentration from minimal input |
| Suspected gDNA contamination | NanoDrop + DNase treatment + gel | Absorbance overestimation check; gel confirms gDNA band at top |
Common RNA Quality Problems and What to Do About Them
The table below covers the most common RNA quality problems, where they come from, and how to address them. Many of these problems overlap — a single extraction error can produce both contamination and degradation simultaneously.
| RNase contamination | Ungloved hands, non-sterile plasticware, contaminated bench surfaces, reagent carryover | RNA degradation before or during extraction; late Ct values; missing low-abundance transcripts | Always wear gloves; use certified RNase-free tips and tubes; clean surfaces with RNase decontamination solution; aliquot reagents |
| Genomic DNA contamination | Incomplete lysis, insufficient DNase treatment, column carryover | gDNA co-amplifies with cDNA, inflating apparent expression; -RT control shows signal within 5 Ct of +RT | DNase treatment before RT (on-column or in-solution); design intron-spanning primers; always include -RT control |
| Guanidine salt carryover | Insufficient column washes during kit-based extraction | Inhibits reverse transcriptase; low or no cDNA yield; 260/230 ratio <1.5 | Add extra wash step; re-purify with ethanol precipitation or cleanup column; check 260/230 before RT |
| Phenol carryover | Acid phenol chloroform extraction (TRIzol); incomplete phase separation | Inhibits both RT and PCR; absorbance spike at 270 nm; 260/230 ratio depressed | Ensure complete phase separation; extra ethanol wash; cleanup column after phenol extraction |
| Prolonged extraction time | Processing too many samples simultaneously; inefficient workflow | Progressive degradation during extraction; variable RNA quality across sample set | Process realistic batch sizes; keep samples on ice; snap-freeze tissue in liquid nitrogen immediately after harvest |
| Freeze-thaw degradation | Repeated freeze-thaw cycles; inconsistent freezer temperature | Progressive degradation with each cycle; declining RIN over time | Aliquot RNA immediately after extraction; store at −80°C; minimise freeze–thaw cycles by aliquoting so each sample is thawed as few times as possible |
| Tissue-specific RNase activity | High-RNase tissues (pancreas, spleen, liver) degrade RNA rapidly during extraction | Consistently lower RIN from these tissues even with correct technique | Snap-freeze immediately; use rapid lysis protocols; consider adding RNase inhibitor during homogenisation |
| Ethanol carryover | Insufficient drying of column or pellet | Inhibits downstream enzymatic reactions; may not affect purity ratios significantly | Dry column with extra centrifugation spin; air-dry pellet briefly (do not over-dry) |
What the Protocol Doesn’t Tell You
Worth knowing
- A 260/280 of 2.0 can mask a completely failed extraction. The 260/280 ratio only reports the relative proportion of nucleic acid to protein. If your RNA is heavily contaminated with genomic DNA, the 260/280 will still read 2.0 because DNA and RNA absorb at the same wavelength. You need the 260/230 ratio and ideally a gel or Bioanalyzer trace to know whether your sample is actually usable.
- Samples with identical RIN values can give different qPCR results. RIN is a bulk measurement of ribosomal RNA integrity. Two samples with RIN 7 might have very different mRNA populations — one could have intact mRNA with slightly degraded rRNA, while the other has the opposite pattern. If your targets are long or low-abundance, you may see Ct variability between samples that the RIN does not predict. The only reliable confirmation is a validation experiment: run a 3′ and a 5′ amplicon on the same transcript and compare the Ct difference.
- A low 260/230 is often the most useful early warning for RT failure. Most beginners check the 260/280 and move on. In practice, the most common RT-qPCR failures from contamination come from guanidine or phenol carryover, which shows up in the 260/230 but not the 260/280. The 260/230 is not a standalone predictor of downstream success — acceptable ratios vary by workflow — but if you only check one ratio, check the 260/230.
- RNA from cell culture and RNA from tissue are not the same extraction problem. Cell culture RNA extraction is nearly trivial — high cell counts, low RNase background, consistent starting material. Tissue extraction is where quality becomes unpredictable. Different tissues have wildly different RNase content, connective tissue that resists homogenisation, and endogenous pigments that co-purify. If you’re switching from cell culture to tissue for the first time, expect to optimise your extraction separately and validate with a Bioanalyzer, not just a NanoDrop.
- Over-drying an RNA pellet can make it impossible to resuspend. Protocols say “air-dry the pellet.” What they don’t say is that if you leave it too long (more than 5–10 minutes at room temperature), the pellet becomes glassy and insoluble in water. You then lose sample trying to get it back into solution, and what does dissolve may be partially degraded from the extended time at room temperature. Brief drying — just until the ethanol smell is gone — is enough.
Common Mistakes
| Skipping the 260/230 ratio check | RT reactions fail or give inconsistent yields despite good 260/280 | Check both ratios on every extraction; flag anything with 260/230 <1.8 |
| Using NanoDrop concentration without accounting for gDNA | Apparent RNA concentration is high but cDNA yield is low; -RT control shows amplification | Use a fluorescent RNA-specific dye (RiboGreen) for accurate concentration; DNase treatment reduces gDNA but NanoDrop still measures total nucleic acid absorbance |
| Comparing expression between samples with different RIN values | Fold changes are inconsistent across replicates; 3′ targets appear stable but 5′ targets vary | Check RIN on all samples before RT; exclude samples with RIN more than 2 units below the batch median |
| Storing RNA in water instead of a stabilisation buffer | RIN declines over weeks even at −80°C; replicates extracted on different days give different results | Store aliquots at −80°C in nuclease-free water, low-EDTA TE, or a workflow-compatible stabilisation buffer; avoid repeated freeze–thaw cycles |
| Processing too many samples at once | Later samples in the batch have lower RIN than earlier ones | Process in batches of 6–12; keep samples on ice throughout; randomise treatment groups across batches |
| Assuming FFPE RNA can be assessed by RIN | RIN returns 2–3 for every FFPE sample regardless of extraction quality | Use DV200 for FFPE; RIN algorithm requires ribosomal peaks that FFPE RNA lacks |
Originally written by Dr. Karen O’Hanlon Cohrt. Renovated with RIN-by-application thresholds, DV200 guidance, assessment method comparison, and expanded troubleshooting.
This article is part of the RNA quality for RT-qPCR guide, which covers RNA assessment from extraction through to QC. For the full method map, return to the qPCR hub.
References & further reading
- Schroeder A, Mueller O, Stocker S, et al. (2006) The RIN: an RNA integrity number for assigning integrity values to RNA measurements. BMC Mol Biol 7:3. PubMed
- Fleige S, Pfaffl MW (2006) RNA integrity and the effect on the real-time qRT-PCR performance. Mol Aspects Med 27:126–139. PubMed
- Vermeulen J, De Preter K, Lefever S, et al. (2011) Measurable impact of RNA quality on gene expression results from quantitative PCR. Nucleic Acids Res 39:e63. PubMed
- Bustin SA, Benes V, Garson JA, et al. (2009) The MIQE guidelines: minimum information for publication of quantitative real-time PCR experiments. Clin Chem 55:611–622. PubMed
- Wieczorek D, Delauriere L, Schagat T. Methods of RNA quality assessment. Promega Corporation. Promega
- Agilent Technologies. RNA Integrity Number (RIN) – Standardization of RNA Quality Control. Application Note 5989-1165EN. Agilent
You made it to the end—nice work! If you’re the kind of scientist who likes figuring things out without wasting half a day on trial and error, you’ll love our newsletter. Get 3 quick reads a week, packed with hard-won lab wisdom. Join FREE here.