
No, iPOND is not a sleek electronic fishing device from Apple. However, if you thought about fishing, well, you’re not far off the mark. If you find yourself wondering which proteins are present at DNA during or after replication, iPOND is an elegant technique to help you find out.
In this article, I will explain how iPOND works and how it can be modified to suit your specific needs. Let’s go fishing!
What Is This Fishing Expedition – How Does iPOND Work?
In his famous play Romeo and Juliet, Shakespeare asks us “What’s in a name?”. In the case of iPOND, the name reveals the essence of the technique. iPOND: isolation of proteins on nascent DNA. So, there you have it. iPOND allows us to isolate the proteins present on newly synthesized DNA with high spatial and temporal resolution.
Sirbu and colleagues at Vanderbilt University School of Medicine developed this technique and first published it in 2011.1 Since then, it has provided a method to investigate the dynamics of proteins present on DNA during or after replication, under either unperturbed or challenged conditions. Let’s take a step-by-step look at the technique (Figure 1).
Choose a free resource to help you move forward
DOWNLOAD
Western Blot Troubleshooting Card
CHEAT SHEET
Western Blot Cheat Sheet

Create Some Bait – EdU Labeling of Replicating DNA
iPOND relies on the ability to discern newly replicated DNA from the bulk DNA in cells. The trick here is to coerce cells into incorporating a slightly different version of the endogenous deoxynucleoside thymidine during DNA synthesis.
Mammalian cells can take up and phosphorylate the thymidine analog 5-ethynyl-2’-deoxyuridine (EdU). This allows EdU incorporation, instead of thymidine, during DNA synthesis (Figure 1A). In this way, EdU effectively marks the DNA that underwent synthesis while this thymidine analog was present in the cell culture medium.
Catch Your Fish – Cross-Linking and Biotinylation
After pulsing with EdU, cells are fixed by formaldehyde treatment. Formaldehyde is a cross-linking agent that covalently attaches protein-DNA complexes, effectively stopping DNA replication (Figure 1B).
With all the DNA and protein complexes now fixed, a metaphorical fishing hook is attached to the EdU that has been incorporated into the nascent DNA. EdU contains an alkylene functional group, which can be covalently linked to a biotin azide by copper-catalyzed cycloaddition — that is click chemistry to us non-chemist mortals.2 With this biotin-EdU fishing hook, we are now ready to fish out our cross-linked DNA-protein complexes from the cells.
Reel ‘Em in – Pull down of DNA-Associated Proteins
The next step in the iPOND procedure is to break the cells open and sonicate the lysate. Sonication shears the DNA, which reduces background signals. DNA and protein will be cross-linked throughout the genome. But the sheared DNA fragments will be either biotin-EdU-labeled or non-labeled (Figure 1C). In this way, we can specifically fish out the DNA pieces that were replicated when EdU was present in the culture medium.
The fishing is done through a good old-fashioned pull down procedure. Sprinkle some streptavidin-coated beads into the lysate, and leave the fish to bite overnight. The biotin moiety on the EdU-labeled DNA will bind the streptavidin moiety on the beads with very high affinity. This, and the fact that proteins are cross-linked to the DNA, means that nonspecific proteins can be washed off using very stringent conditions.
What Did We Catch? – Protein Analysis
Finally, we are ready to have a look at our fish. The DNA-protein cross-links are reversed and the proteins eluted off the streptavidin-coated beads by boiling in a denaturing buffer (Figure 1D). You now have a sample containing the proteins that were present at the EdU-labeled DNA at the time of cross-linking.
If you know what you are looking for, you can go ahead and western blot against you favorite protein(s). Alternatively, you could take an unbiased approach. iPOND samples can be processed for mass spectrometry, which allows for unbiased detection and quantification of the proteins and even their post-translational modifications (PTMs). In 2013, Sirbu and colleagues and Lopez-Contreras and colleagues were the first to use iPOND coupled to mass spectrometry to identify more than 100 proteins specifically enriched at replication forks.3,4
What Do You Want to Fish For? Varying Experimental Design
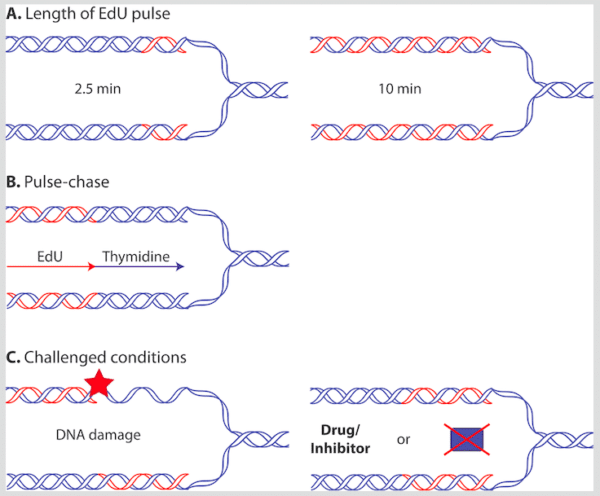
If you want to catch a specific kind of fish you need to adapt the bait. Similarly, you can adapt iPOND to investigate specific conditions related to DNA synthesis. Varying the conditions during EdU addition or timing of EdU addition itself will determine which processes you are analyzing (Figure 2). In the next few sections, we will take a look at some examples.
Which Proteins Are Present at and behind the Replication Fork?
Varying the Length of the EdU Pulse
The longer the cell culture is incubated in the presence of EdU, the more DNA will be replicated. Therefore, longer stretches of DNA will be labeled (Figure 2A). This implies that very short incubations with EdU will result in samples containing the proteins involved in actively synthesizing DNA. Longer incubations will yield samples containing these proteins as well as proteins left behind the active replication fork and other proteins that bind nascent DNA.
A 2.5-minute incubation with EdU is enough to detect components of the active replication fork. When taking the speed of EdU diffusion, phosphorylation and DNA synthesis into account, the estimate is that iPOND has a resolution of 1 to 2 kilobases of DNA.1,5
Which Proteins Are Present at the Replication Fork in Early or Late S-Phase?
Synchronization and Timing of the EdU Pulse
Synchronizing cells has several advantages. When released collectively into S-phase, more cells will actively incorporate EdU. This allows you to use less cellular material to achieve the same amount of sample compared to using unsynchronized cells. In this case, you will need 1×10⁸ cells — the equivalent of three 15-cm dishes of confluent HEK293 cells.1,5
Another advantage of synchronization is the possibility to add EdU at different times during S-phase. This will allow you to investigate which proteins are present at DNA synthesized in early versus late S-phase. Kliszczak and colleagues at the National University of Ireland Galway used this setup as a proof of principle when publishing a technique highly similar to iPOND in 2011.6
Which Proteins Are Present at Maturing Chromatin?
Pulse-Chase Experiments
Maybe you are not actually interested in DNA synthesis per se. Perhaps you are more interested in how the DNA-protein environment, the illustrious chromatin, is established once the DNA has been replicated. Well fear not, you can tailor your DNA-bait to catch this fish as well.
In this case, you can do a pulse-chase experiment. This involves first “pulsing” cells by incubating them shortly with EdU and then “chasing” by adding excess thymidine. In this way, the EdU-labeled DNA is left behind the forward-moving replication fork (Figure 2B). The proteins now present at the EdU-labeled DNA will be involved in establishing chromatin, dealing with DNA replication errors or bypassed damage rather than synthesizing the DNA. Alabert and colleagues at the University of Copenhagen employed this approach to investigate the differences between nascent and maturing chromatin using a technique highly similar to iPOND, which they termed nascent chromatin capture (NCC).7
Which Proteins Are Present at Perturbed Replication Forks?
Challenging DNA Replication
‘Normal is boring’, you say. ‘I want to know what is going on at challenged replication forks’. Or ‘I want to know what my protein does at the replication fork’. Fine, we can do that too.
You can pulse cells with EdU in the presence of drugs that challenge DNA synthesis or damage DNA (Figure 2C). In this setup, you can investigate which proteins are present when the replication fork cannot continue normally or when it meets a specific DNA lesion.
You can also do the experiment in the presence of functional inhibitors of specific proteins or processes. Or in cells that have your favorite gene mutated or deleted. Now, you can investigate the impact of your process or gene of interest on the protein landscape of DNA synthesis.
Ultimately, your imagination is the limit for how you can twist iPOND into fitting your research interest. Provided, of course, that this relates to DNA synthesis. You can combine the above examples or maybe you have something completely different in mind. You need not even limit your experimental creativity to DNA replication. In principle, every cellular process involving DNA synthesis (e.g., DNA repair processes outside S-phase) can be studied with the iPOND technique.
Now that you know how iPOND works and how you can adapt it to answer your favorite DNA synthesis-related research question, you can start fishing. Or you can join me for part 2 of this article series, were we will compare fishing poles and find out how iPOND compares to a few of the other techniques we commonly use to investigate the protein landscape of the DNA.
Why should I use iPOND?
So you’ve learned how the iPOND technique can help us investigate the protein landscape of DNA synthesis. Next we will pit iPOND against a few other widely used techniques in order to answer the question: ‘Why should I use iPOND instead of [insert-your-(second)favourite-technique-here]?´
However, before we start measuring fishing poles, let’s start with a brief recap of iPOND itself. Going by the instructive name of ‘isolation of proteins on nascent DNA’, iPOND allows us to do just that in four major steps:
- Pulse cells with EdU in order to label replicating DNA.
- Formaldehyde cross-link proteins bound to DNA and add biotin to the EdU-labelled DNA trough a click-chemistry reaction.
- Pull down EdU-labelled DNA and the proteins bound to it by lysing cells and adding Steptavidin-coated beads.
- Reverse cross-links and analyse eluted proteins by western blotting or mass spectrometry.
Et voilà! You now know which proteins were bound to the part of the DNA that was replicated while pulsing with EdU and at the time of cross-linking. As an added bonus, you can tailor your iPOND experiment to investigate very specific conditions. For example, you can vary the timing and length of the EdU pulse or impose different stresses on the cells.
My Fishing Pole Is Better Than Yours…
It sounds very smart this iPOND, doesn’t it? But how does it actually compare to some other techniques we commonly use? Now, iPOND comes head to head with a few of these other techniques in a fishing contest of three rounds.
Round 1: iPOND vs. Immunoprecipitation
If you are a biochemist, your method of choice for studying protein complexes will probably be to immunoprecipitate a complex component (say for instance the DNA polymerase) and identify its interactors. Like iPOND, this can be done using both targeted and untargeted approaches – by western blotting and mass spectrometry, respectively. Immunoprecipitation can also be combined with chromatin fractionation to reveal protein interactions that take place on the DNA.
The great advantage of iPOND over the classical immunoprecipitation is the additional DNA synthesis-specific spatial information that you get using EdU labeling of the DNA.
Round 2: iPOND vs. ChIP
Chromatin immunoprecipitation (ChIP) is another technique often used to investigate proteins associated with DNA. ChIP is similar to iPOND in that you cross-link proteins and DNA and then perform a pull down. However, the pull down and detection is reversed in ChIP compared to iPOND. In a ChIP experiment, you immunoprecipitate a protein component and then isolate, amplify and detect the DNA bound to this protein. In an iPOND experiment, you pull down the DNA and then detect the proteins bound to this DNA.
One advantage of ChIP over iPOND is that the readout signal (the DNA sequences bound by the protein) is amplified by PCR. You therefore need much less cellular material to perform a ChIP experiment. However, you also need to know the sequences of the DNA you are looking for (e.g. an origin of replication). This is because you need to design primers to perform the amplification and detection steps. This knowledge is not required to gain spatial information about your proteins using iPOND. For iPOND, all you need to do is add EdU.
Round 3: iPOND vs. Immunofluorescence Microscopy
Maybe you are a fan of immunofluorescence microscopy? You can stain cells for replication fork components with specific primary and fluorescent secondary antibodies. This enables you to use fluorescence microscopy to visualize the location of these proteins and measure their signal intensity. Immunofluorescence microscopy also allows you to follow these signals dynamically with time and treatment. Or even in live cells if you use fluorescent fusion proteins. It is not possible to perform iPOND in live cells. However, it does have an advantage over immunofluorescence microscopy with regards to sensitivity. iPOND can detect proteins present in only a single copy at the replication fork while immunofluorescence microscopy cannot.
In spite of the need for a massive amount of starting material, iPOND has a combination of advantages not currently offered by other techniques. iPOND allows you to:
- Integrate spatial and temporal information about proteins present at specific sites during the dynamic process of DNA synthesis.
- Vary the experimental setup endlessly to provide answers for very specific
- Detect proteins and even their post-translational modifications in a highly sensitive and unbiased manner using mass spectrometry.
If you feel like going fishing, H. Dungrawala and colleagues at Vanderbilt University School of Medicine published an updated iPOND protocol in 2015.8
Reference
- Sirbu BM, Couch FB, Feigerle JT, Bhaskara S, Hiebert SW, Cortez D. (2011) Analysis of
protein dynamics at active, stalled, and collapsed replication forks. Genes Dev.
25(12):1320–7. - Moses JE, Moorhouse AD. (2007) The growing applications of click chemistry. Chem Soc
Rev. 36(8):1249–62. - Lopez-Contreras AJ, Ruppen I, Nieto-Soler M, Murga M, Rodriguez-Acebes S, Remeseiro S, Rodrigo-Perez S, Rojas AM, Mendez J, Muñoz J, Fernandez-Capetillo O. (2013) A proteomic characterization of factors enriched at nascent DNA molecules. Cell
Rep. 2013 Apr 25;3(4):1105–16. - Sirbu BM, McDonald WH, Dungrawala H, Badu-Nkansah A, Kavanaugh GM, Chen Y, Tabb DL, Cortez D. (2013) Identification of proteins at active, stalled, and collapsed replication forks using isolation of proteins on nascent DNA (iPOND) coupled with mass spectrometry. J Biol Chem. 288(44):31458–67.
- Sirbu BM, Couch FB, Cortez D. (2012) Monitoring the spatiotemporal dynamics of proteins at replication forks and in assembled chromatin using isolation of proteins on nascent DNA. Nat Protoc. 2012 Mar 1;7(3):594–605.
- Kliszczak AE, Rainey MD, Harhen B, Boisvert FM, Santocanale C. (2011) DNA mediated chromatin pull-down for the study of chromatin replication. Sci Rep. 1:95.
- Alabert C, Bukowski-Wills JC, Lee SB, Kustatscher G, Nakamura K, de Lima Alves F, Menard P, Mejlvang J, Rappsilber J, Groth A. (2014) Nascent chromatin capture proteomics determines chromatin dynamics during DNA replication and identifies unknown fork components. Nat Cell Biol. 16(3):281–93.
- Dungrawala H, Cortez D. (2015) Purification of proteins on newly synthesized DNA using iPOND. Methods Mol Biol. 1228:123-31.
You made it to the end—nice work! If you’re the kind of scientist who likes figuring things out without wasting half a day on trial and error, you’ll love our newsletter. Get 3 quick reads a week, packed with hard-won lab wisdom. Join FREE here.


