Spectral unmixing in flow cytometry is the key to great full spectrum flow data. Get this wrong, and you risk unreliable results. Read on for 7 top tips to nail your unmixing every time.
Do you perform spectral unmixing only to find ‘swooping data’ and ‘non-round’ negative populations? These are due to unmixing errors, which can lead to false positives and incorrect data (Figure 1).
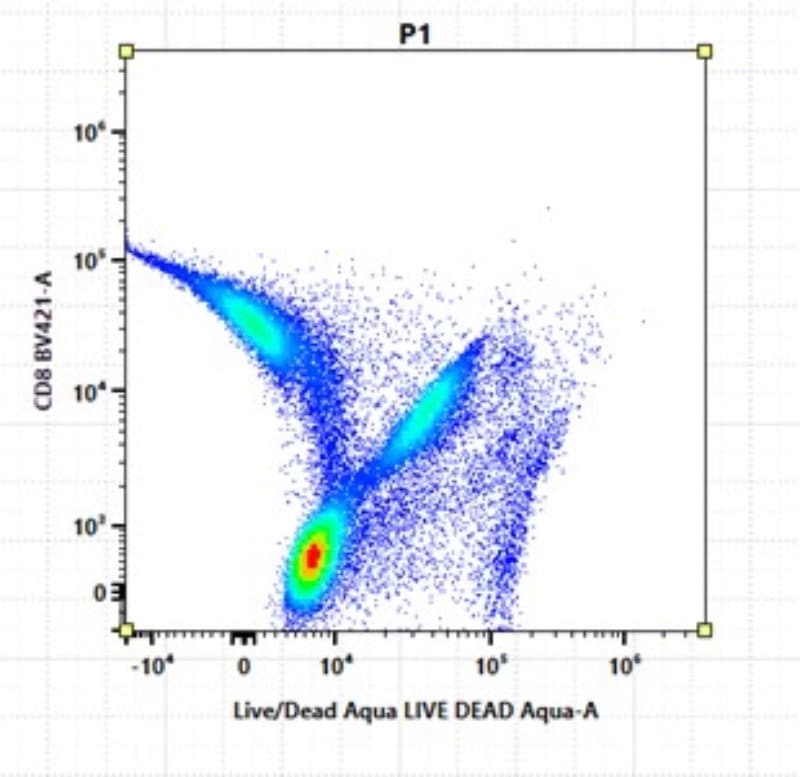
The secret to accurate unmixing lies in the quality of your single-color controls.
What is Full Spectrum Flow?
Traditional flow cytometry uses filters to measure a small portion of the fluorescence emission as excited from one laser. Fluorophores that emit similar wavelengths, e.g., Af647 (Alexa Fluor® 647) and APC (Allophycocyanin), are detected in the same filter and cannot be used together (Figure 2).
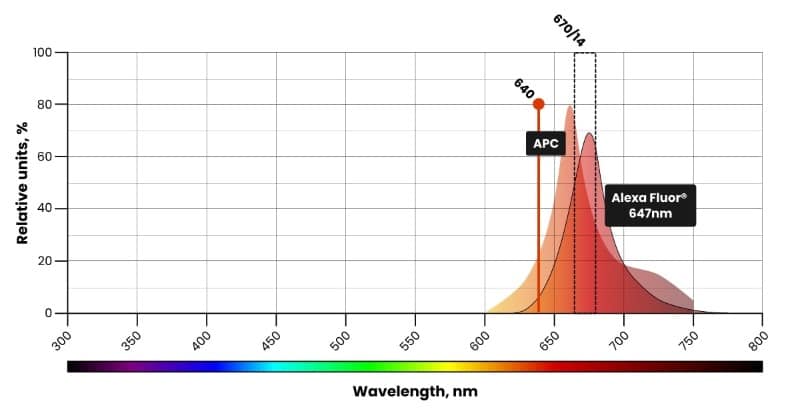
(Image credit: Thomas Warwick)
Unlike conventional flow cytometry, we record the ENTIRE EMISSION as excited by ALL LASERS in full-spectrum flow cytometry. We can use any fluorescence combinations that have significant differences in the shape of their spectra and the number/location of emission peaks.
The similarity of two spectra is compared using the similarity index; any two colors with a similarity index of <0.98 will unmix and can be used together in a panel.
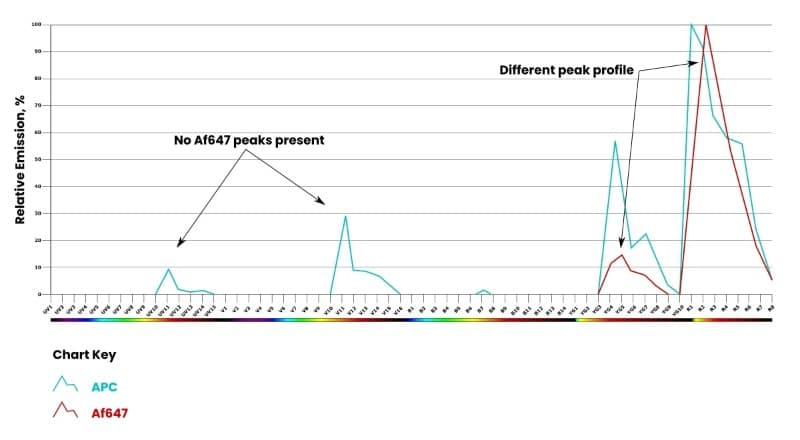
In the example below, Af647 is not excited by the UV/V laser and is missing peaks in detectors UV10-UV14 and V10-V15 (Figure 3). The emission peaks of APC have higher intensity, are shifted, and are differently shaped compared to the emission peaks of Af647. APC and Af647 have a 0.9 similarity index—which is sufficient to unmix and use together in a panel.
Key Terms
Spectral signature: The median fluorescence intensity (MFI) in each detector from each laser produces a ‘fingerprint’ (Figure 4).

Reference control: A single-color control to determine the spectral signature of each fluorescence in our multi-color sample.
Spectral unmixing: Comparing the full spectrum of our multi-color sample (Figure 5) with our single-color reference controls enables the separation of the mixed spectra into individual fluorophores, e.g., FITC/APC.

Similarity Index: Compares how similar the spectra of two fluorophores are on a scale of 0–1 (1 = similar, 0 = unique, <0.98 = spectrally unique).
Complexity Index: The measure of the similarity of all the fluorophores in the panel. The lower, the better. If designed well, the complexity of the 10-color panels will be 2–3, and the 40-color panel will be 40–50.
Similarity and complexity indices can be calculated using Cytek’s spectrum viewer or Cytek Aurora software (Spectroflo).
So, I just run single-color controls? Easy, right?
Reference controls will perfectly unmix your reference controls. But the point of unmixing is to separate the many spectra in your multi-color sample to identify cell populations.
The spectral signature of your reference controls must therefore be a true reflection of the spectral signature in your multi-color sample.
Otherwise, you get unmixing errors. Unmixing errors equals false positives. Get your reference controls bang-on and save yourself the headache.
7 Top Tips for Nailing Your Unmixing
1. Prevention is Better Than Cure
You might be tempted to ‘compensate out’ the unmixing errors. That’s not very scientific of you! It’s also incredibly time consuming. Applying compensation to ‘correct’ unmixed data should only be used as a last resort to ‘rescue’ bad data.
- DO: If you must apply compensation, use single color controls on cells to determine the amount of compensation to apply.
- DON’T: Apply compensation to a full stain until it ‘looks’ right.
- DO: Spend the time optimizing single-color controls so that you don’t have to rescue your data.
2. Follow the Five Rules for Reference Controls
If your reference controls adhere to these five rules, your unmixing should be accurate first time.
Bright is Better
The positive peak in the reference control must be as bright or brighter than in the multi-color sample.
Like-With-Like
The autofluorescence of the positive must be identical to the autofluorescence of the negative.
A special consideration is the viability dye reference control. Dead cells are more autofluorescent than live cells. Using stained dead cells as the positive and live, unstained cells as the negative violates this rule.
To create a viability stain reference control:
- Heat kill cells.
- Split into two.
- Stain half. This is your positive spectral signature.
- Do not stain the other half. This is your negative with matched autofluorescence.
Matched Fluorophore
The same fluorophore must be used in the reference control as in the multi-color sample. They might both be green, but you can’t substitute GFP for FITC.
Same Lot of Tandem
There is lot-lot variation between tandem dyes. You must use the same lot for your control as for your multi-color sample
Identical Conditions
Fixatives, light, and heat can affect fluorescence—especially tandems. Consider which buffer each fluorophore has been exposed to (Table 1).
Table 1. Staining buffer exposure.
Marker | Location | Buffers exposed to |
CD3 | Surface | Staining, fixative, permeabilization |
Foxp3 | Intracellular | Staining |
Top tip: these rules are also true for compensation in conventional flow cytometry!
3. Be a Perfectionist
Beads vs Cells
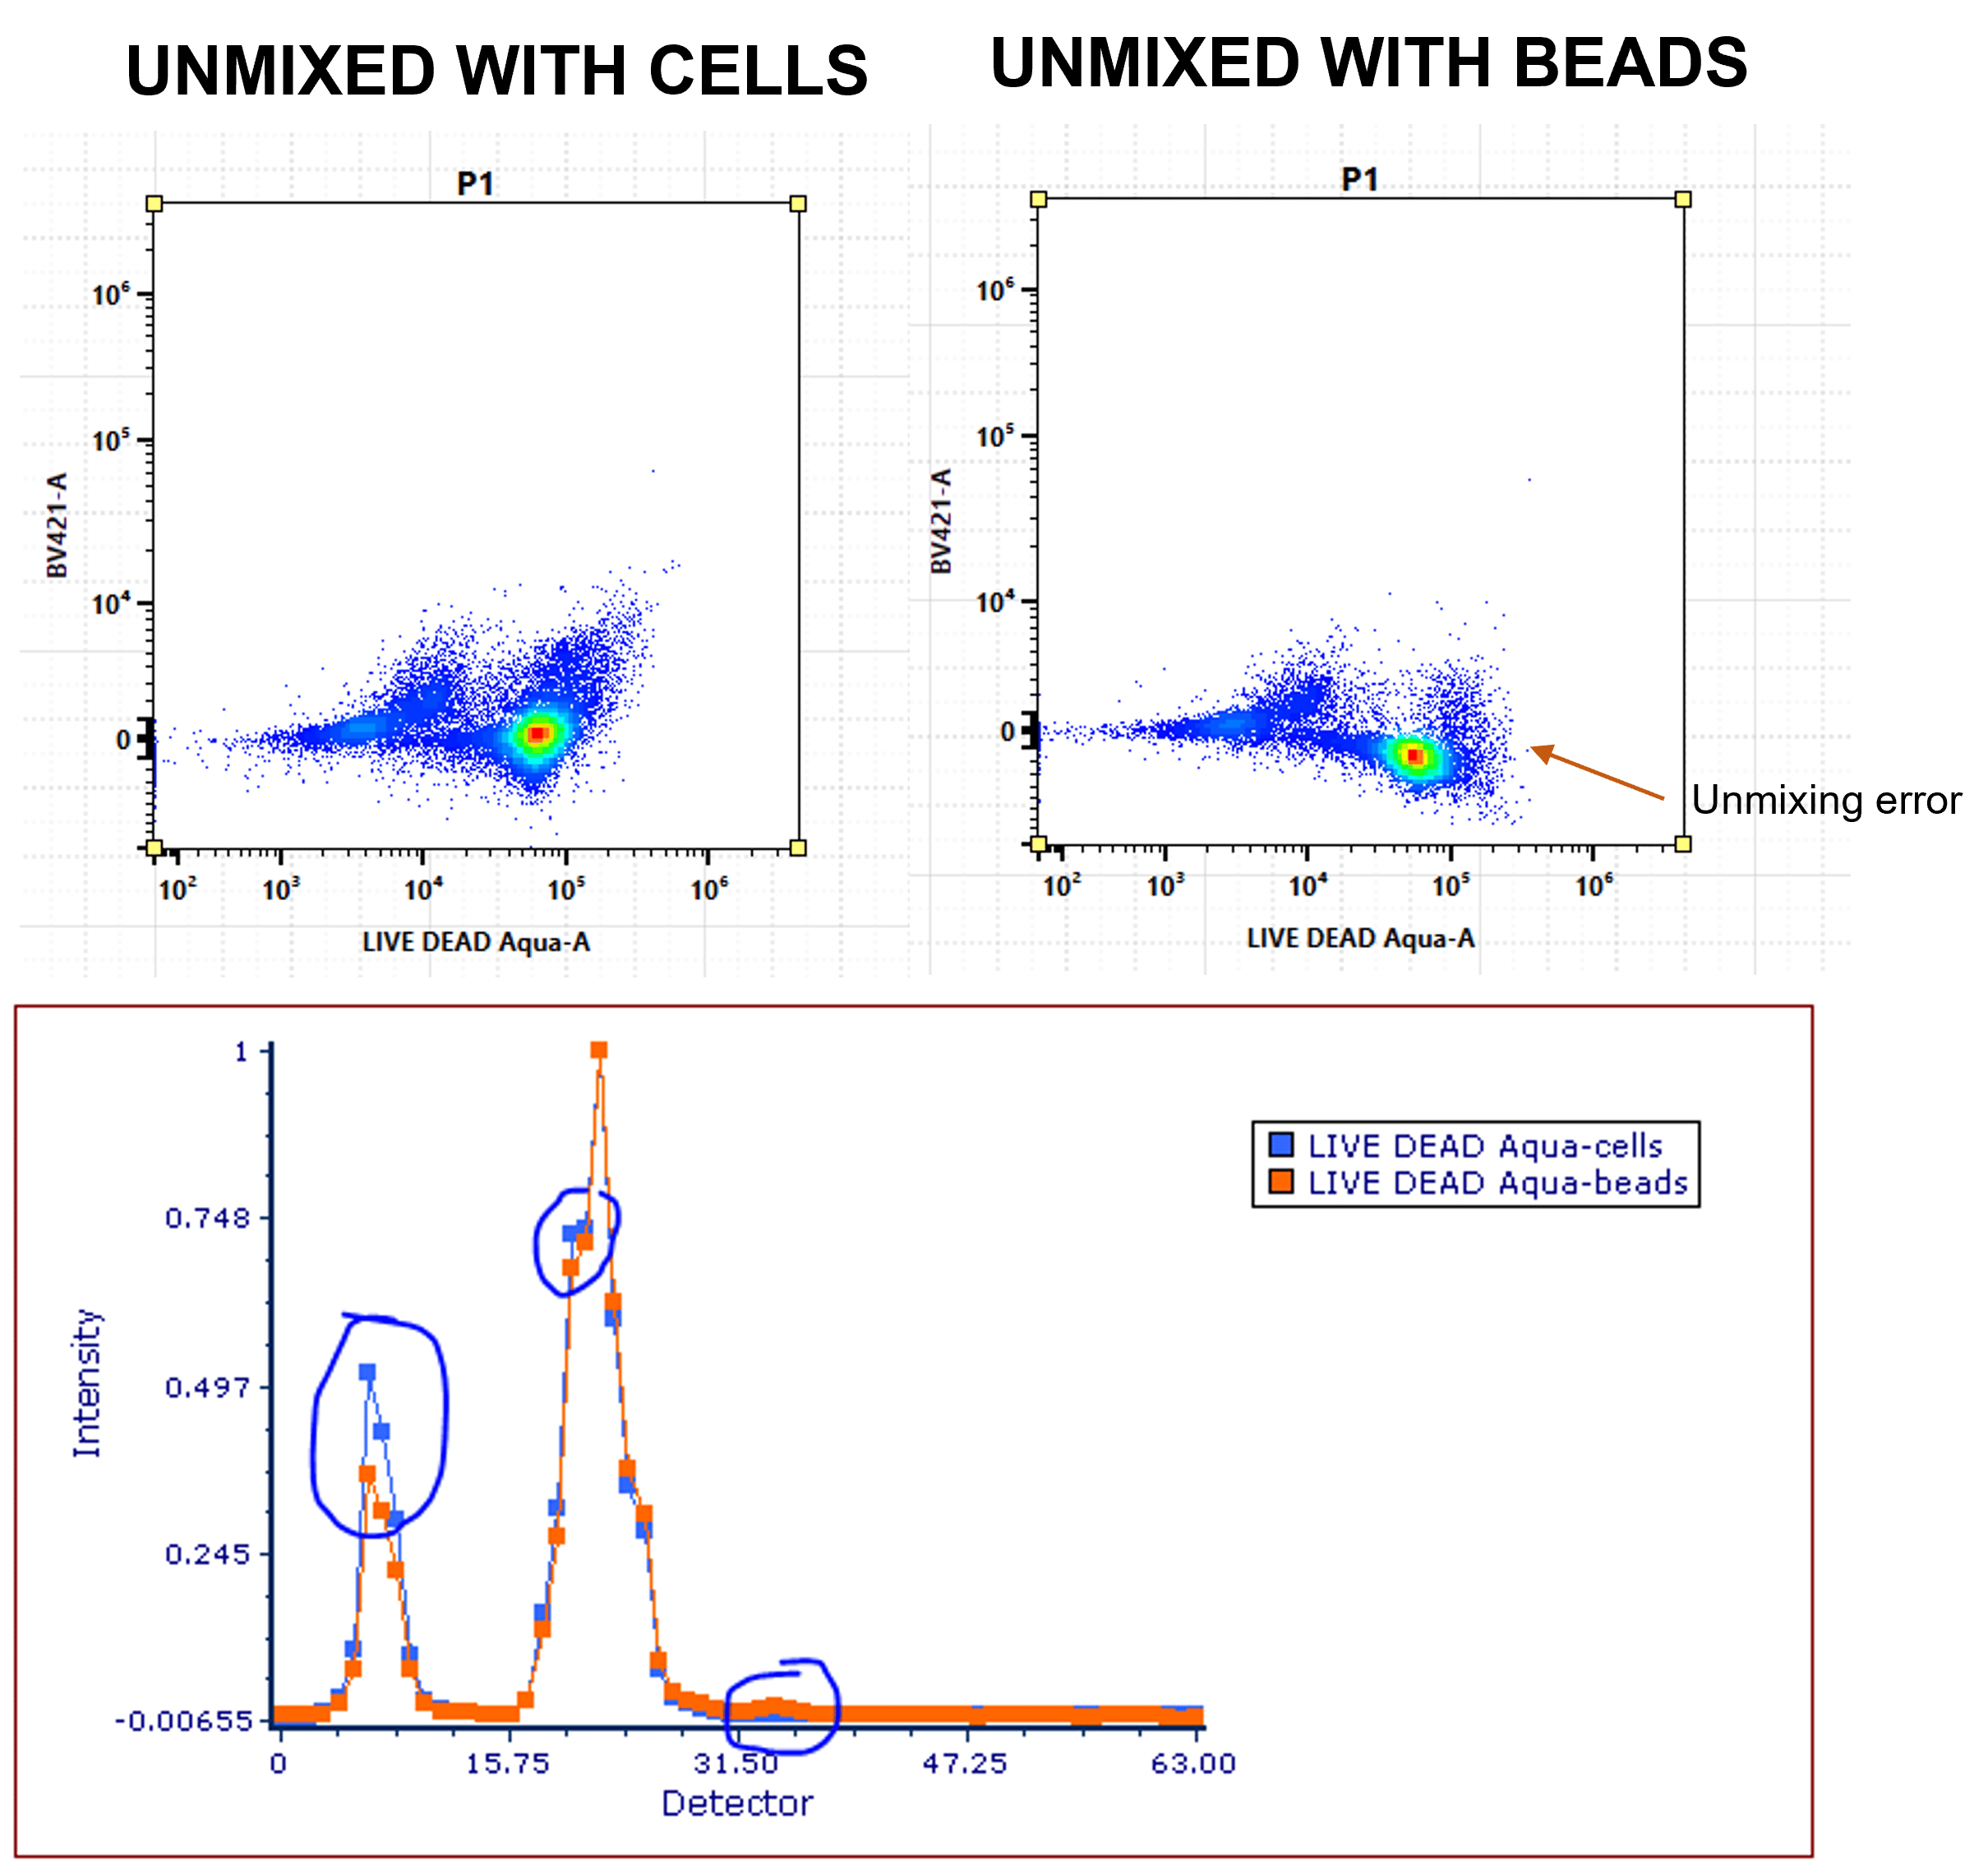
For accurate unmixing, the reference spectra must be a true reflection of the signature in the multi-color sample. Sometimes, the spectra might be different when attached to compensation beads.
- DO: Optimise your single-color controls. Record each reference control on beads and cells and overlay the normalized spectra. If spectra differ, you’ll need to use cells for that reference control (Figure 6).
4. Get Your Detective Hat on
Autofluorescence
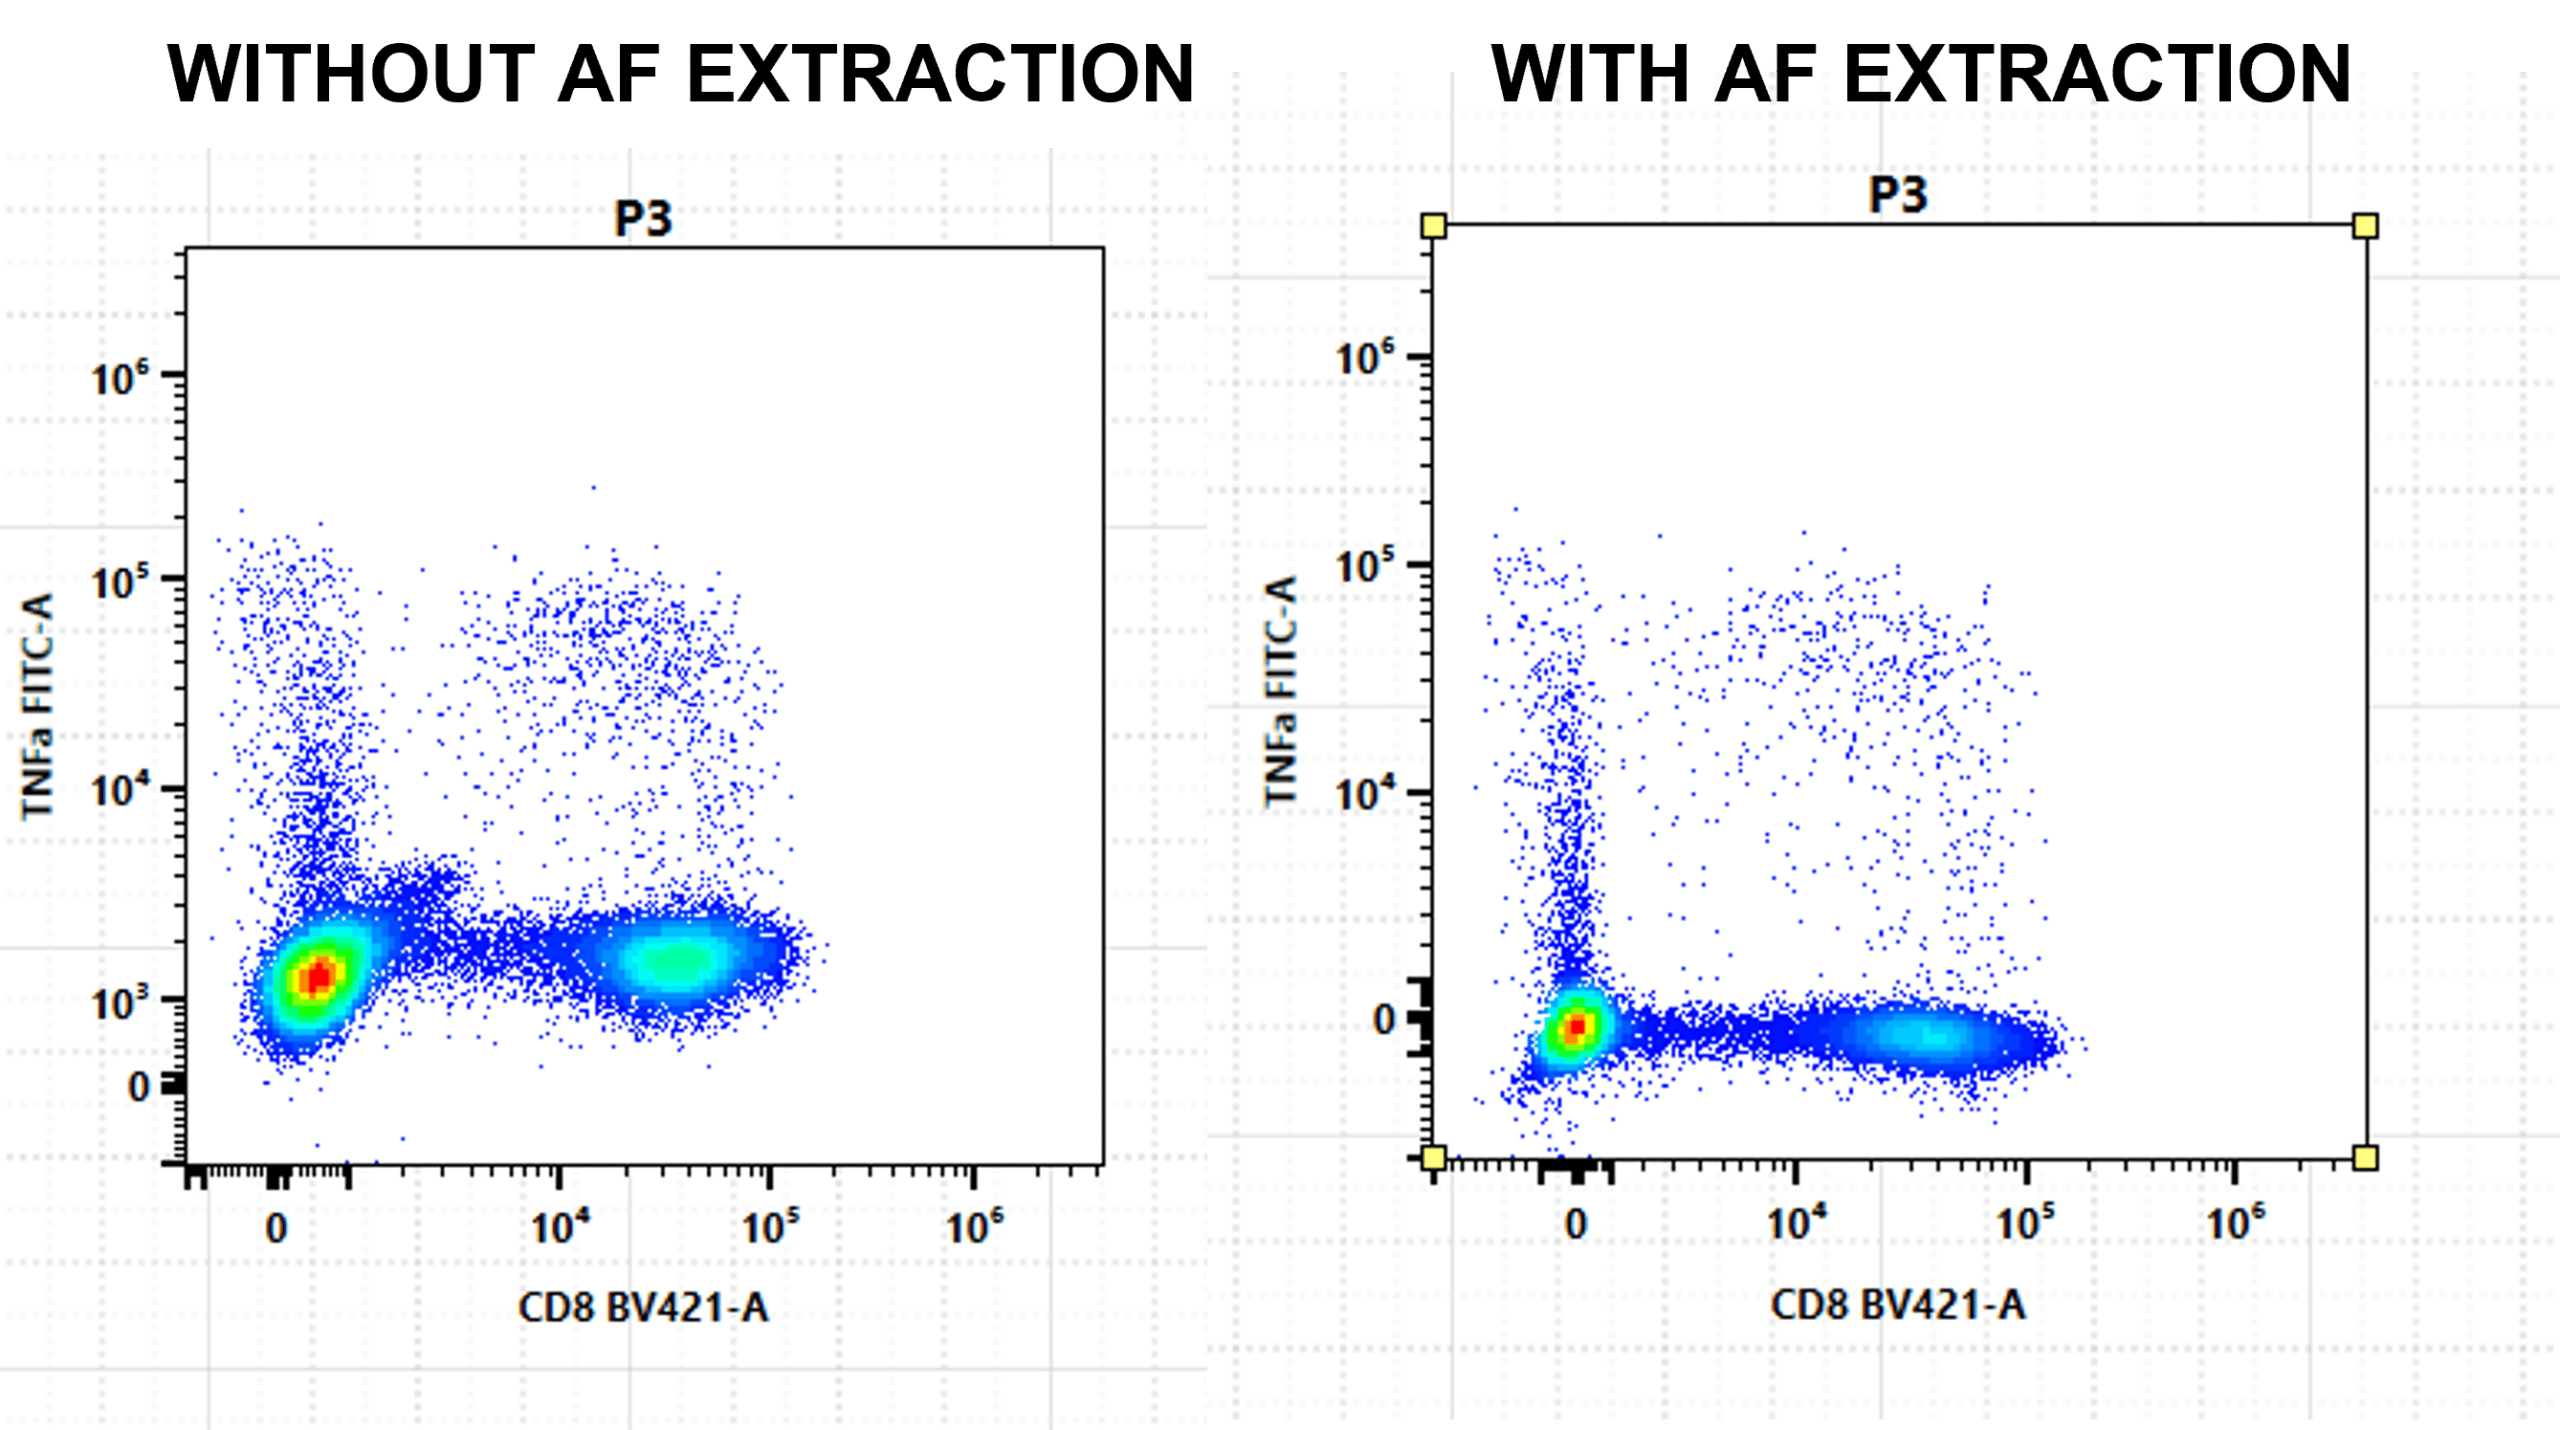
If you have highly autofluorescent or heterogeneous autofluorescent populations, you will want to extract autofluorescence (Figure 7). Cell types with different autofluorescence can be used as reference controls.
Single Stain vs Multi-Color
For each fluorophore, compare the histogram of a single stain on cells with the multi-color sample. If you see an increase in spread, it suggests that a combination of spectral signatures is causing spread in your data. Back to the drawing board. Tweak your panel to reduce similarity indices—the lower the complexity, the less chance of unmixing errors.
Embrace the Negative
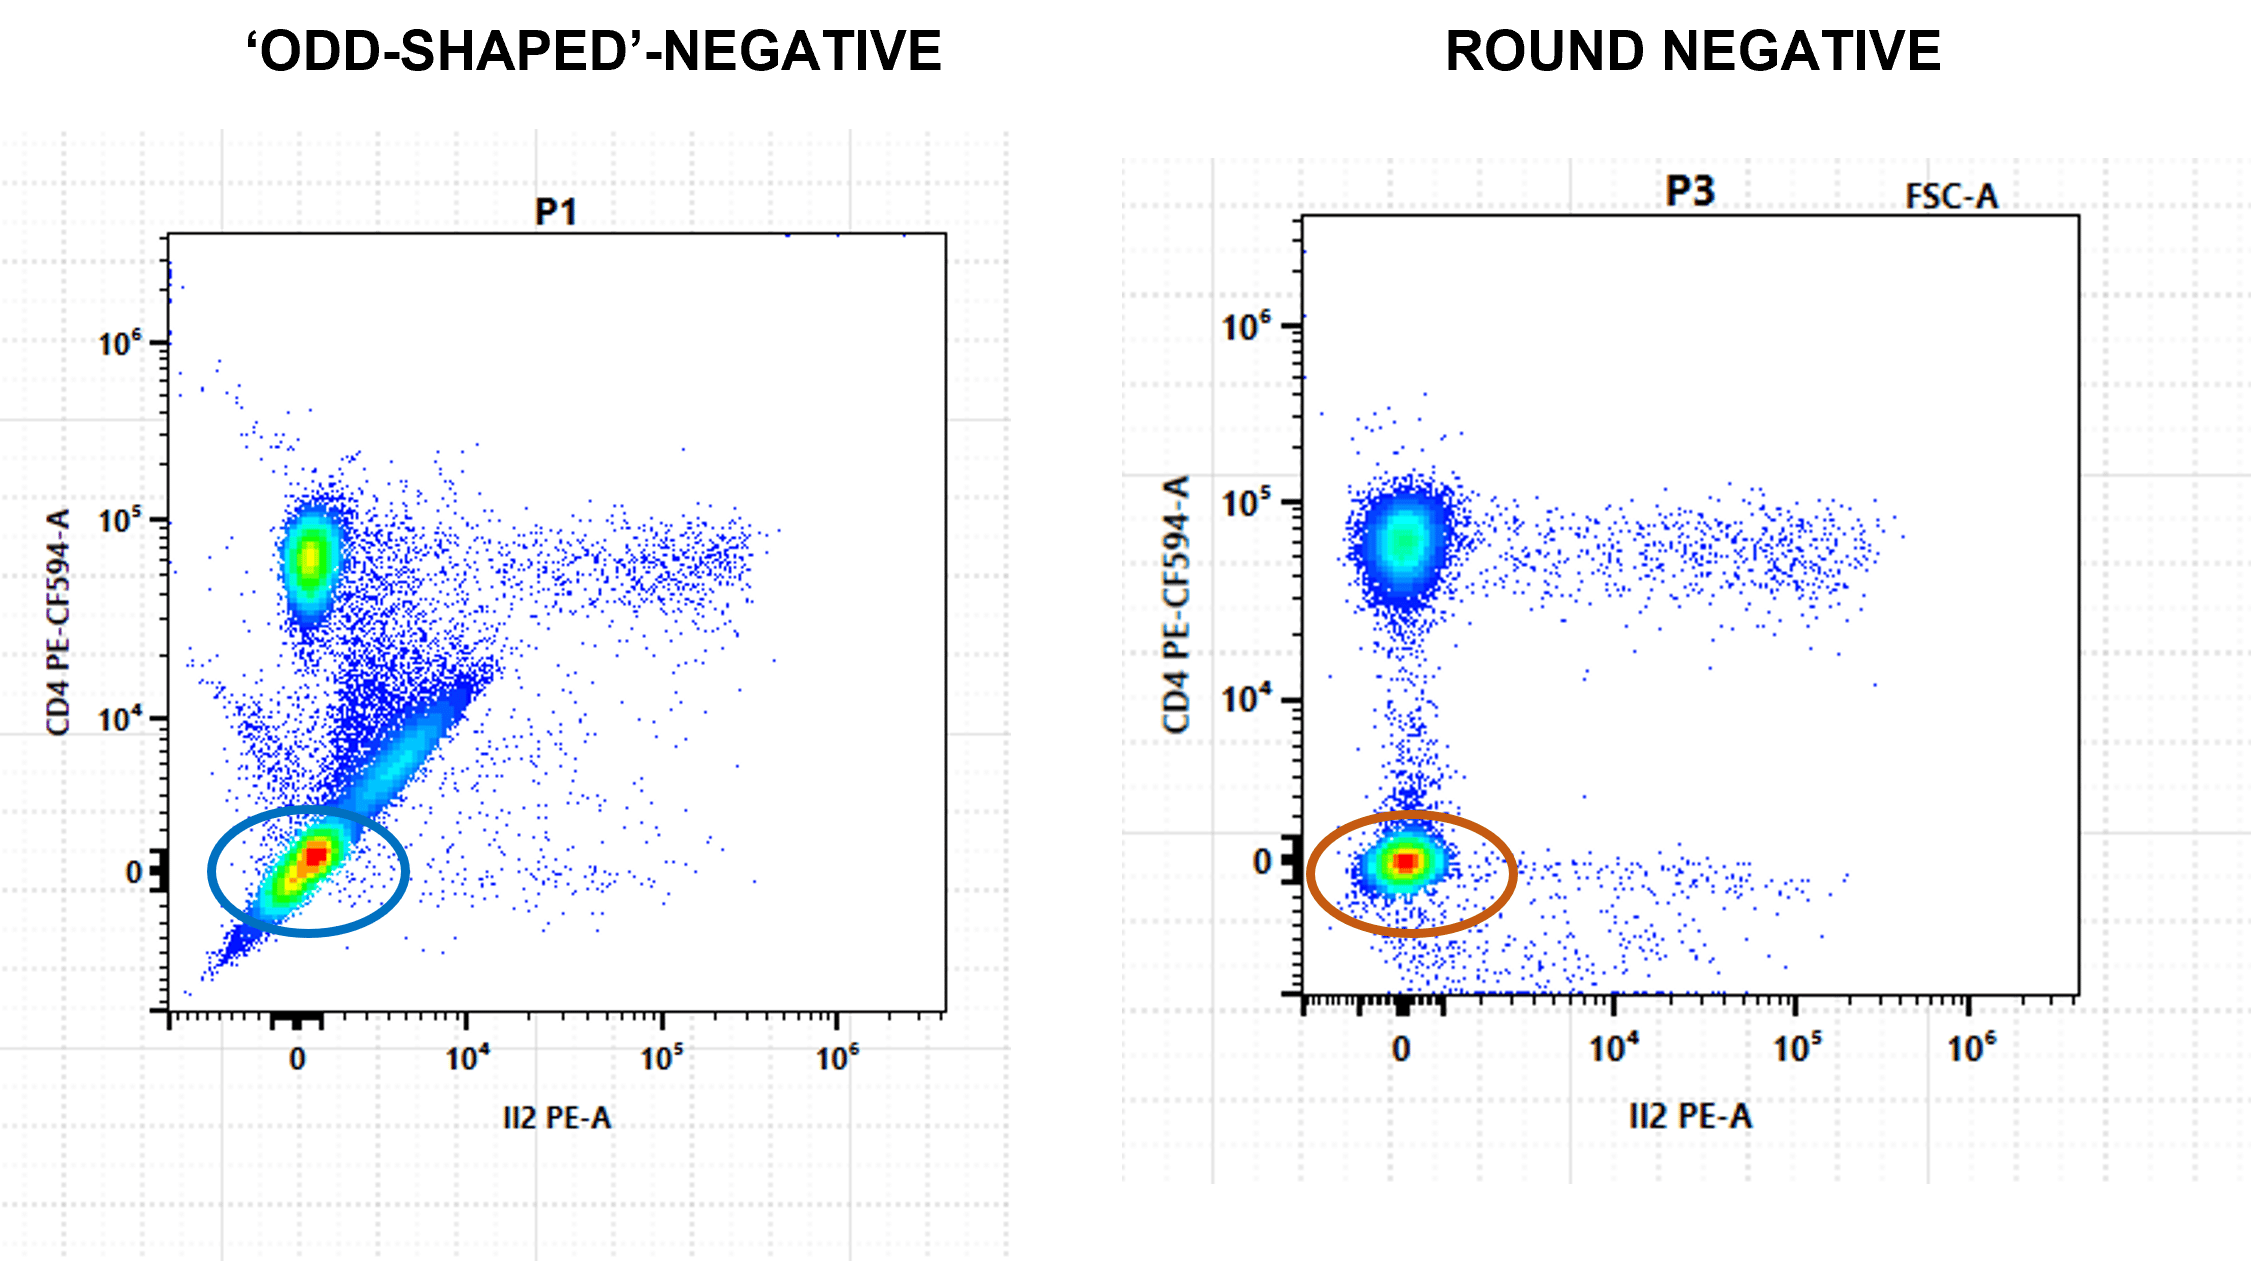
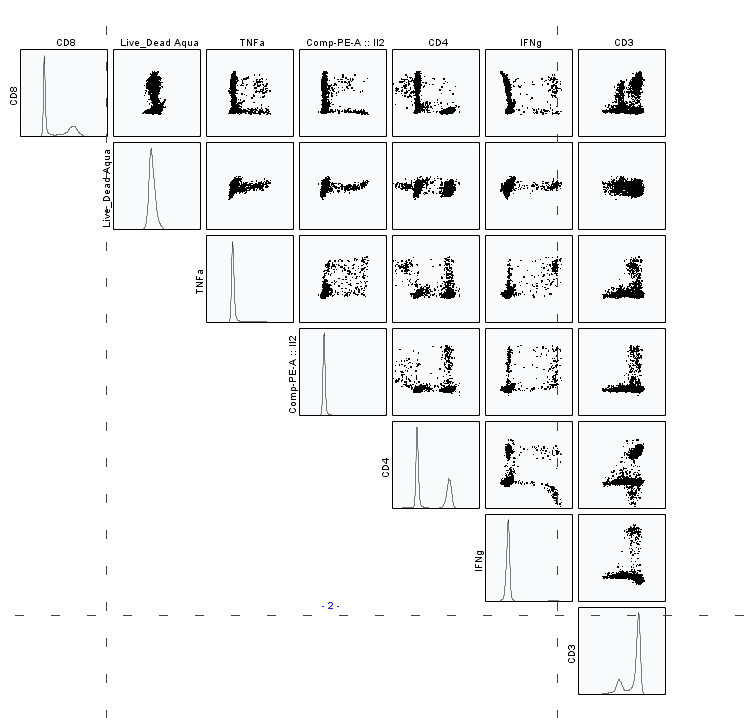
Swooping positive populations are not the only indication that you have unmixing errors—odd-shaped negatives and ultra-negative populations reveal a multitude of sins (Figure 8). Plot all fluorophores on NxN plots to find the culprit (Figure 9).
5. Location Matters
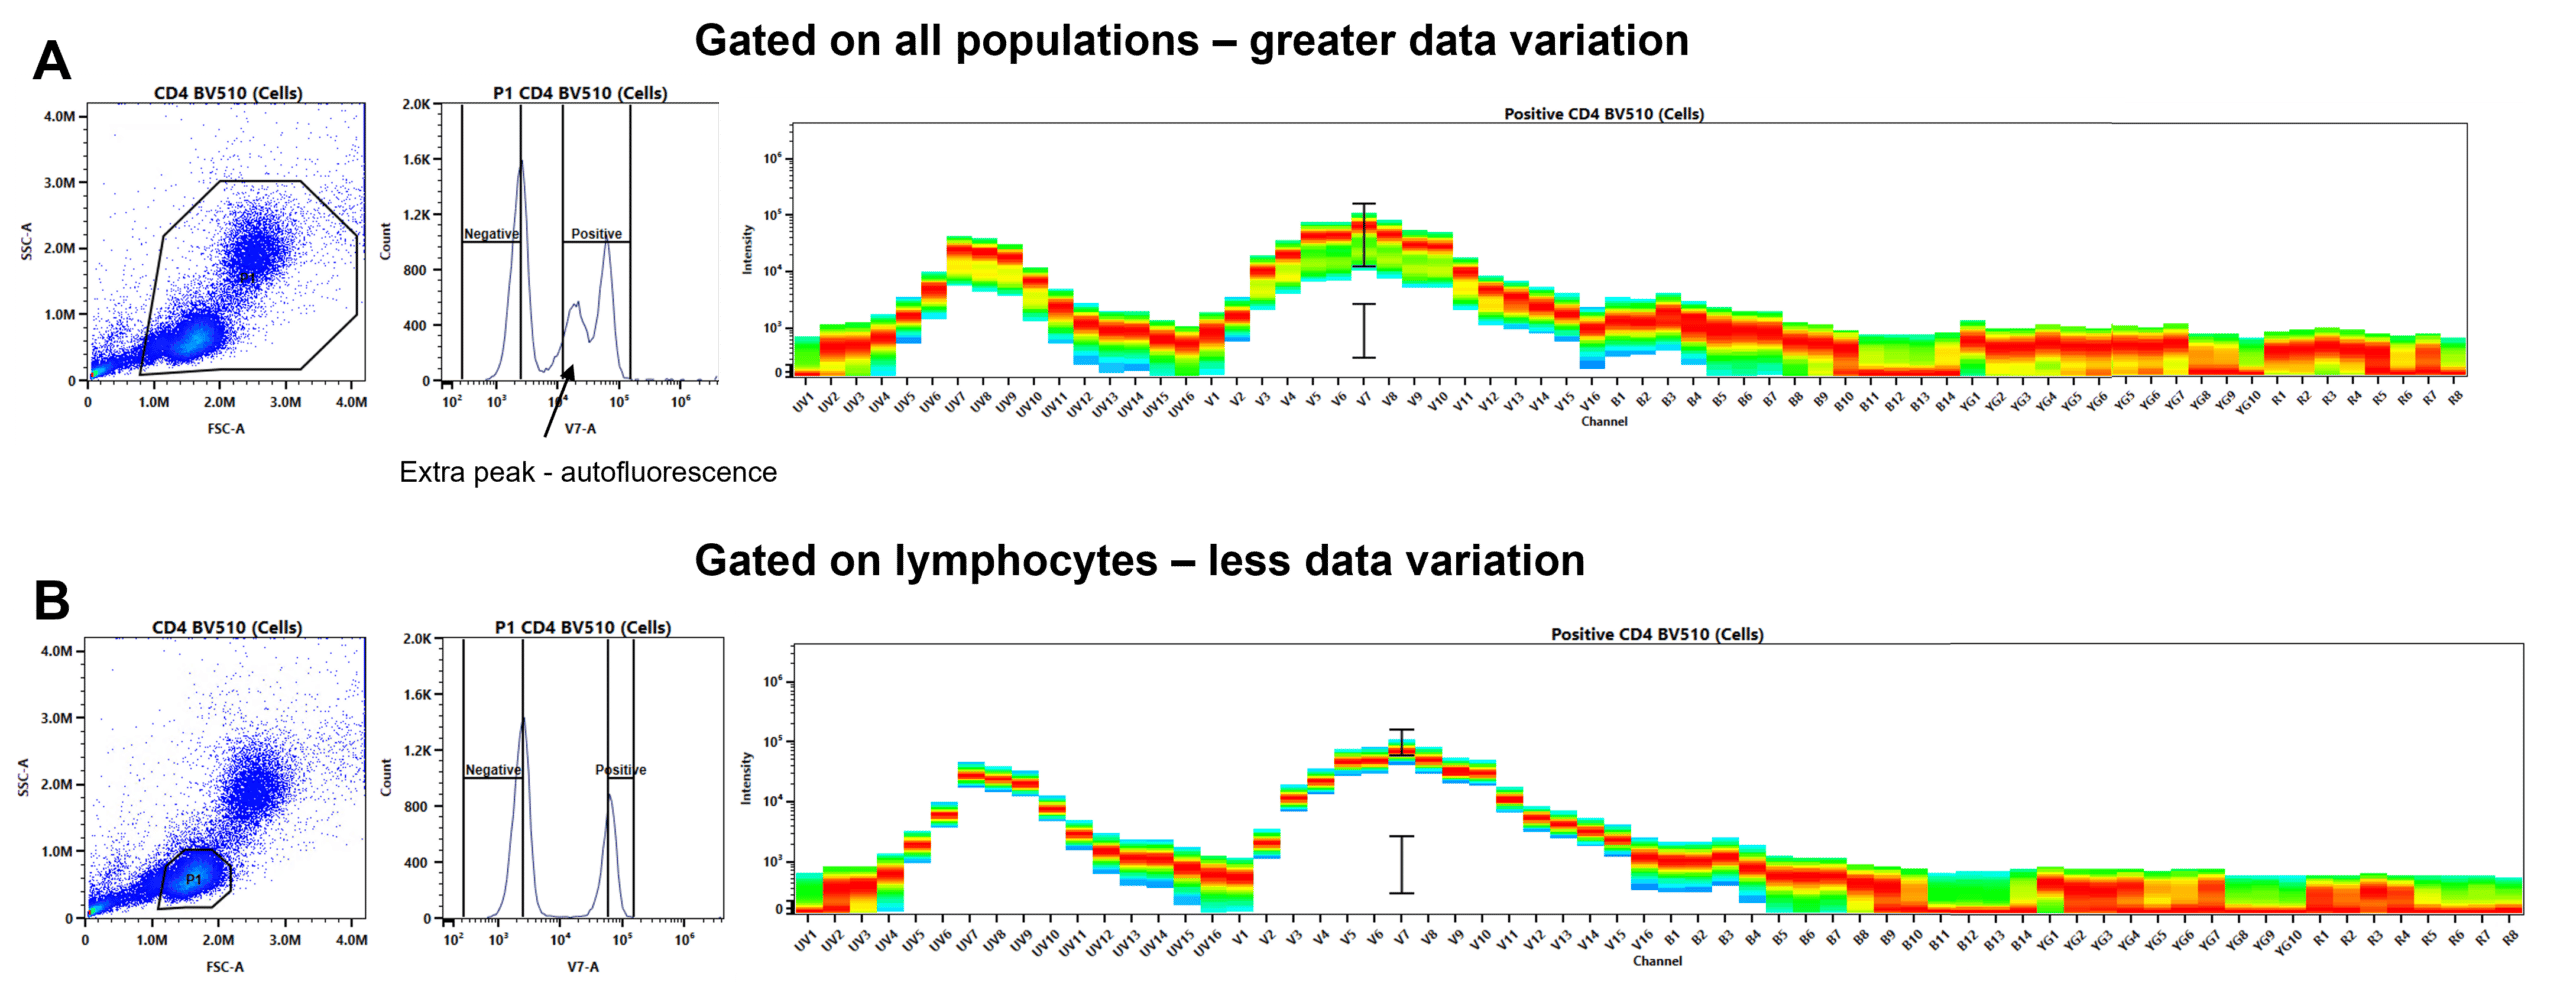
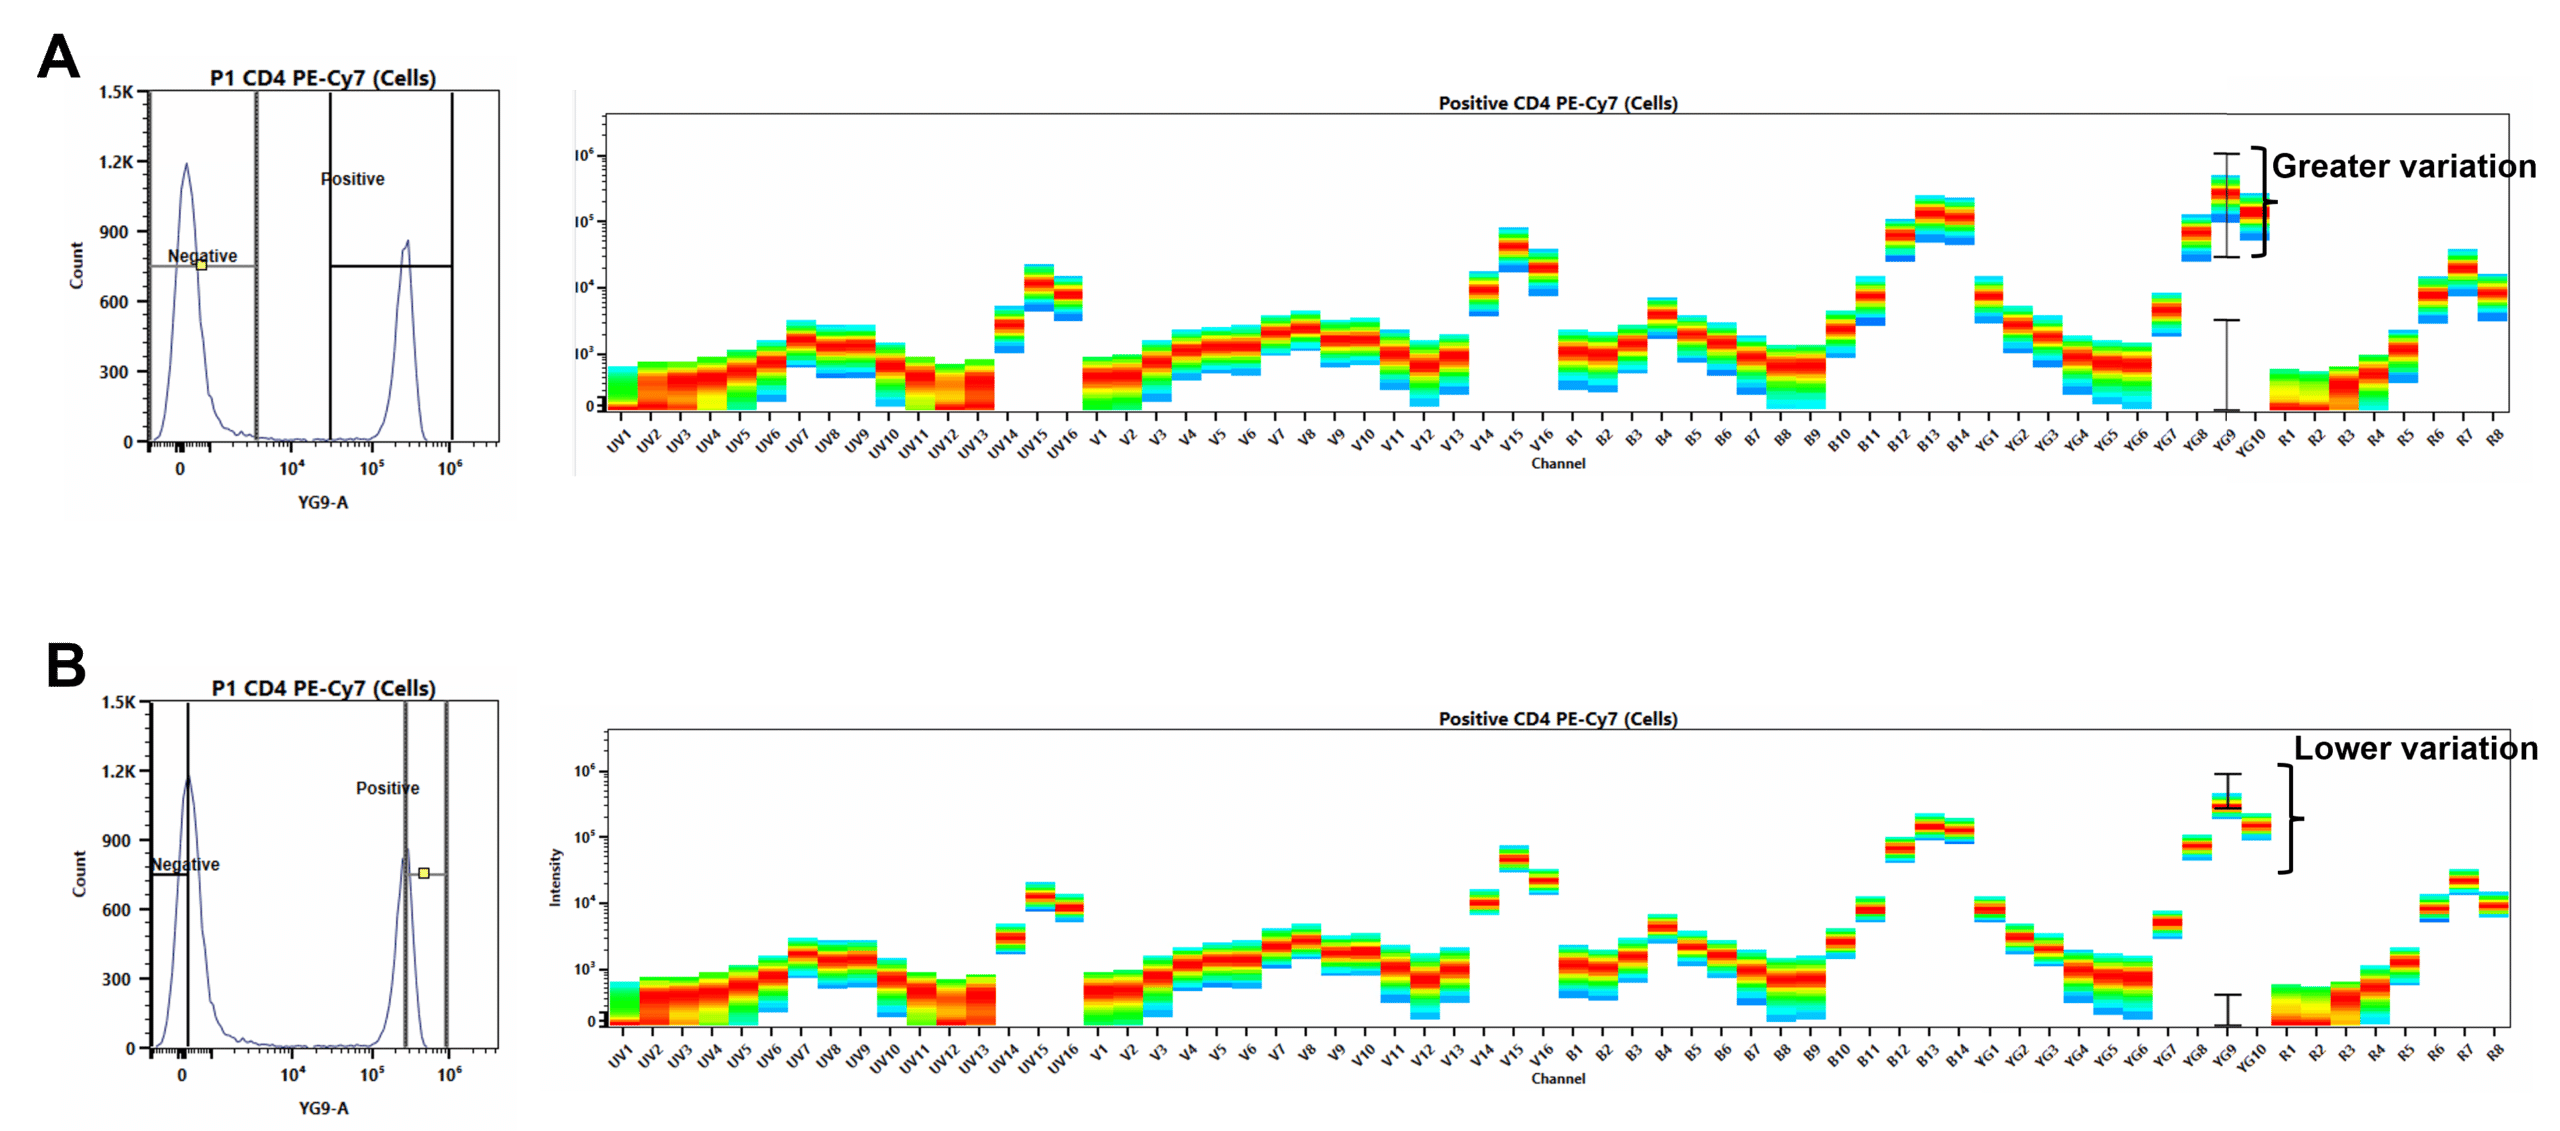
The reference spectra should be as ‘clean’ as possible. This means low variation in MFI. Accurate gating will go a long way to reducing data variation (Figure 10).
- DON’T: Include doublets in your size gate, as they will have a range of fluorescence.
- DON’T: If gating on mixed cell populations, don’t gate on all populations; e.g., if your marker is on T cells, gate around the lymphocytes. A mixed population will have a range of autofluorescence (violating rule 2!) and a range of marker expression.
- DO: Draw a narrow gate on the top half of the positive peak and the lower half of the negative peak to minimize variation in MFI.
6. Do Your Quality Control
Contaminating fluorophores and ‘broken-down’ tandem dyes will contribute to variation in the MFI (Figure 11).
- DO: Move the positive gate over the negative peak and check that it is negative. Big blue streaks and peaks where there shouldn’t be, suggest your negative is stained/partially stained.
- DON’T: Use controls with multiple positive peaks where there should only be one (there may be multiple peaks on cells). This could be due to the breakdown of tandem dyes or contamination.
7. Now You Can be Lazy: The Reference Library
Is the thought of recording 20+ reference controls each time filling you with dread?
Good news! Once you are confident you have the perfect reference controls, you can record them into a reference library for reuse.
- DO: validate how long the reference library controls can be reused. The rule of thumb is one month, but you should validate. Monitor change in spectra overlay or check for unmixing errors over time.
- DON’T: Record bad reference controls. A big fat waste of time, as all your future experiments will have unmixing errors.
Final Word on Spectral Unmixing in Flow Cytometry
Spectral unmixing can be difficult, and unmixing errors lead to false positives and bad data. Now that you know how to optimize your single-color reference controls with these 7 top tips, you should achieve accurate unmixing. Take the time to optimize your controls!

