If you want to find the interaction between a pair of proteins, chances are you’ve already come across yeast two-hybrid (Y2H) screening, but have you encountered quantitative yeast two-hybrid screens?
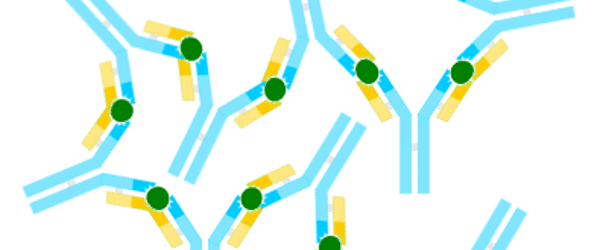
To refresh your memory, here is an overview of the principle behind standard Y2H screening. An amazing aspect of this technique is that you can quantify the reactions and compare the relative strength of physical interaction among multiple pairs of proteins, and all you have to do is pick the right reporter gene.
Standard qualitative Y2H assays use reporter genes like LEU2/URA3 where interaction between your proteins of interest will allow the strain to grow on media lacking leucine/uracil. Quantitative Y2H assays on the other hand use reporter genes encoding \beta-galactosidase/ fluorescent proteins where you can quantify the amount of enzyme/fluorescence produced by each interaction and compare the binding strength of different pairs of proteins.
In this article, we’ll take you through the \beta-galactosidase (\beta-gal) assay, an easy and inexpensive assay using the E. coli LacZ gene that produces the \beta-galactosidase enzyme as a reporter. I’ll cut right to the chase and explain step-by-step.
4 Steps of Quantitative Yeast Two-hybrid Screens
Step 1: Plasmid Acquirement
For the \beta-gal assay, you need three plasmids.
- Bait plasmid: this encodes one of your proteins of interest fused with the DNA-binding domain of a transcription factor.
- Prey plasmid: this encodes another protein of interest fused with the activation domain of the transcription factor.
- Reporter plasmid: this contains the LacZ gene with an upstream promoter for the composite transcription factor to bind.
Pro tips:
- Use an inducible promoter for your reporter plasmid to ensure simultaneous activation of the LacZ gene in all of your strains. GAL promoters are commonly used as they are easily induced in the presence of galactose and repressed in glucose media.
- To utilize GAL promoters, your prey protein needs to be fused with the activation domain of the transcription factor Gal4. Gal4 will bind to the GAL promoter in presence of galactose and induce downstream LacZ expression.
- For your bait plasmid, use the DNA-binding domain of a prokaryotic protein with no homolog in yeast to avoid false-positive signals.
Step 2: Strain Generation
This part is easy. You need to transform your yeast strain with the reporter, bait, and prey plasmids. You can use either electro-competent or chemically competent cells to insert the plasmids in your strains. You can perform a co-transformation with all three plasmids at the same time or you can insert the plasmids one at a time.
In the end, successfully transformed cells will grow on a triple drop-out media based on the auxotrophic markers your plasmids are encoding. Some of the commonly used auxotrophic markers in yeast are URA3, LYS2, LEU2, TRP1, HIS3, MET15, and ADE2.
Let’s say your bait plasmid encodes LEU2, your prey plasmid encodes TRP1, and your reporter plasmid encodes URA3: in this case, your transformants will grow on leu- ura- trp- synthetic media.
Pro tip:
Always make a strain with the reporter, prey, and an empty bait plasmid that doesn’t encode any protein of interest; this will help you understand the baseline reporter gene expression and measure signal strength accordingly.
Step 3: Cell Growth and Reporter Induction
Now that you’ve produced your strains with the right combination of plasmids, it’s time to let them make as many copy numbers as possible and induce the reporter gene. To do this efficiently, remember the following:
- Grow the strains to mid-log phase in the appropriate selective media in presence of glucose; glucose is readily utilized by yeast to quickly multiply but will repress the LacZ gene expression. It is important to grow the strain in triple drop-out media or else the cells might lose the plasmids. Here’s a refresher on the different stages of the growth curve.
- Measure the OD600 of the cultures and calculate what volume of each culture you need to obtain an equal number of cells for each strain. For example, if the OD600 of strain A is 0.25, and that of strain B is 0.5, you will harvest 20 mL of A for every 10 mL of B.
- Harvest the calculated volume of cells and wash with cold sterile water to remove any traces of glucose.
- Transfer the cells in induction media (appropriate drop-out media + galactose) and let them grow for at least two doubling times. The doubling time for common laboratory yeast strains is around 90 minutes; if you’re dealing with a mutant strain that tends to progress slowly through the cell cycle, you might want to run a growth curve experiment and find out the doubling time for your strain.
Galactose will activate the Gal4 transcription factor and induce LacZ expression if your proteins of interest are physically interacting.
Pro tip:
Add 1% w/v raffinose to your induction media to enhance LacZ expression. Poor carbon sources like raffinose help relieve glucose repression at GAL promoters, while galactose induces their expression.
Step 4: Cell Lysis and \beta-galactosidase Activity Quantification
After the reporter induction, your assay goes in vitro.
- Harvest and lyse the cells in an appropriate lysis buffer to collect the whole-cell extract (WCE). WCE contains \beta-galactosidase produced by each strain due to the physical interaction of the bait and prey plasmids.
- Add a colorimetric substrate to visualize enzyme expression. The most commonly used substrate is ortho-Nitrophenyl-\beta-D-galactopyranoside (ONPG). This colorless compound produces a yellow o-Nitrophenol end product when hydrolyzed by \beta-galactosidase. Incubate WCE with ONPG and record the time required to produce a visible yellow color; this is your reaction time. The longer you leave the reaction, the more yellow color will be produced, so it’s important to record how long each reaction ran to standardize the enzyme activity in each sample.
- Read the absorbance of your samples at 420 nm and 550 nm, and calculate the units of \beta-galactosidase production as follows:
U=\frac{1000 \times [\textrm{Abs}_{420} - (1.75 \times \textrm{Abs}_{550})]}{t \times v \times \textrm{Abs}_{600}}
where:
U= units of \beta-galactosidase
Abs420= absorbance by yellow o-Nitrophenol
Abs550= absorbance by other cellular products. When multiplied by 1.75, this value mimics scatter by cell debris at 420nm. Deducting this value from the o-Nitrophenol absorbance at 420nm gets rid of the background absorbance and standardizes o-Nitrophenol absorbance for each sample.
Abs600= absorbance by cells, representative of original cell concentration
t= reaction time in minutes
v= reaction volume in milliliters.
Plot your calculated values in a graph, standardize against your empty bait control, and voila! You now know which proteins are strongly interacting, and which proteins don’t get along that well.
Pro tips:
- Perform the in vitro colorimetric assay in a microtiter plate to read absorbance for all the samples simultaneously in a plate reader. If that isn’t possible, add 1 M sodium carbonate (Na2CO3) stop solution to each tube before you start taking absorbance readings one at a time. The high pH of Na2CO3 instantaneously denatures the \beta-galactosidase enzyme and ensures the reaction time is uniform for all samples.
- Standardize the \beta-galactosidase activity against the total protein produced by each strain. Set aside 50\muL of the WCE you made for the \beta-galactosidase assay and perform a Bradford or Lowry assay to quantify protein concentrations. Plot the enzyme activity produced by each interaction as units of \beta-galactosidase/ mg of total protein.
Your end product will look something like this:
Figure 1. Example showing the amount of \beta-galactosidase produced by each interaction in Y2H assay.
In this completely made-up graph, looking at the amount of \beta-galactosidase produced by each interaction you can say that your empty bait control is not interacting with prey plasmids, as you’d expect. Protein A is interacting strongly with protein B and moderately with protein C. Protein B and C are not physically interacting.
That’s it. You are ready to perform a quantitative yeast two-hybrid screen. I hope your proteins get along nicely!


