
Zebrafish are a fantastic resource for analyzing movement behaviors – we can use them to assess the effects of genetic alterations and drug treatments on initiation and performance of movement during all stages of development. For example, when fish are 6 days old we can use a modified (swim) version of the ‘six-minute walk test’ that we use in humans to assess muscle weakness [1]. In this article, I discuss one particular assay to measure movement in zebrafish – the touch response assay – and how to analyze the data using freely available software. This test is useful for addressing questions such as: can the fish feel touch or do they have a sensory defect? Are they able to respond by swimming away? How do they respond? Do they respond once and then tire? If you are interested in the sensory or motor function of your zebrafish model, this is the test to try.
How Does Movement Develop in Zebrafish?
Zebrafish develop the ability to move rapidly over the first few days of life, with the embryos gaining the ability to perform twitching movements in their chorion (egg sack) at just 18 hours post fertilization (hpf). By 27 hpf they can respond to touch and by just 72 hpf they are happily swimming around their Petri dish homes [1]. The progression and phenotype of these well-characterized movements can provide insight into a range of scientific questions, including how well their muscles or neuromuscular junctions are developing.
How Can We Measure Movement in Zebrafish?
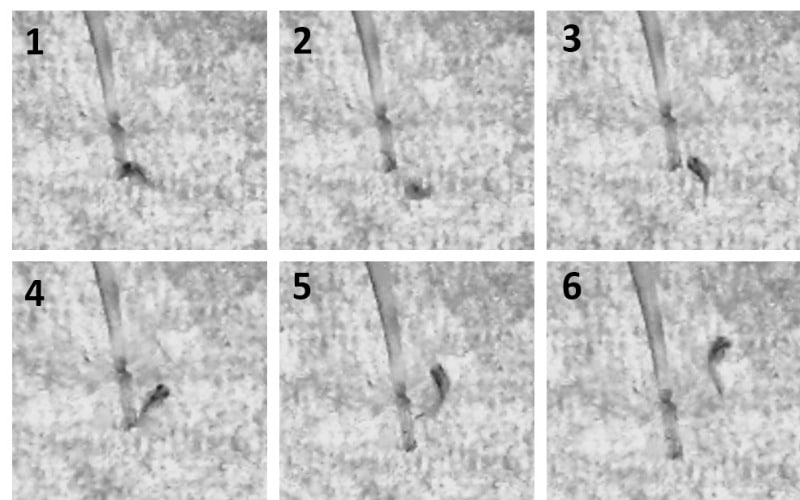
At 48 hpf we can perform a touch response assay [2], which involves tapping the zebrafish on the back of the head with a long, fine pipette tip to stimulate their Mauthner cells. This induces a quick startle response called a C-start turn, in which the fish bends (forming a c-shape – hence the name) and then swims away from the stimulus (Figure 1) [3]. We can record this response and measure different aspects of the zebrafish movement to gain information about their ability to respond to touch, initiate muscle contraction, and swim away.
Equipment
There are a few key items you will need for this assay:
Choose a free resource to help you move forward
PROTOCOL
Chemically Competent Cells Protocol
DOWNLOAD
Culture Contaminants Reference Card
- Clamp stand.
- Video camera capable of recording \(\geq\) 30 frames per second (the faster the better, especially if you want to measure initial acceleration, many labs go upwards of 500 fps – if your lab doesn’t have one already you can usually get all the information you need from a commercially available ‘action camera’ (e.g. GoPro/Nikon).
- Petri dishes.
- A gel-loading pipette tip (snap some of the tip off to give you a shorter probe as it is easier to control – if you don’t have these, get inventive, you just need something fine and blunt to tap them with).
- Some people also like to use a lightbox under the Petri dish while recording, to standardize the illumination; however, I have always found this to cause a flickering effect on videos that makes analysis difficult. A well-lit room works fine.
- A temperature-controlled environment (28°C) – zebrafish movement activity is temperature dependent so use either a room kept at the required temperature or a heated stage.
Set-Up
Place your Petri dish containing medium onto the heated stage or benchtop, ensuring you have a white surface underneath – a few sheets of white paper does the job. Set up a clamp stand holding your camera above the Petri dish, at whatever height allows you to see the edges of the Petri dish on the screen. Make sure you do not have reflections of the lab lights in your dish as it makes analysis difficult – you want homogenous illumination of the dish.
Recording the Videos
Ideally use embryos that have pigment, rather than a pigment-free strain, as it helps to isolate the fish during analysis later on. Collect your 48 hpf embryos and dechorionate them (either by using tweezers or enzyme digestion) and let them acclimatize for 1 hour.
Place a ruler where you will position your Petri dish and take a quick video of this – you’ll need the scale for the data analysis step. Put the Petri dish in place and carefully add one fish to the center of the dish – if it whizzes around it could affect your results by tiring itself out, so remove it and take another.
Press record on your camera, grab your pipette tip, and carefully tap the zebrafish on the back of the head. This should elicit a rapid C-start movement and the fish will swim away from the stimulus, if the fish does not move then try a few more times to make sure the tap was in the correct place, then stop recording. Put the recorded fish in a separate dish to prevent recording the same fish twice – you can keep these fish and use them for future experimentation (e.g. for staining, growing up to later stages, and other behavioral assays), therefore allowing you maximize the data obtained from each animal and reducing the number used. Continue until you have enough data for your experiment, as a starting point record around 15 fish per test group and see if you identify any differences.
Software Set-Up
You have just spent hours tapping zebrafish larvae on the head and recording their movement response, and now you’re faced with the question of how to extract some meaningful, quantitative data to support your observation that ‘they move differently’.
You can use the freely available, open-source, Fiji software to analyze your videos. The protocol takes a bit of time to get through, but it is something you can do sitting in front of the TV once you get the hang of it!
- Install the ‘FFmpeg’ video importer.
- Open Fiji, go to help > update, then ‘manage update sites’ on the ImageJ updater screen.
- Find the FFMPEG update site, tick the box and click ‘apply changes’.
- After restarting Fiji, go to file > import > movie (FFMPEG) > select the video of the ruler.
- Untick ‘use virtual stack’ every time you open a video and leave the other settings.
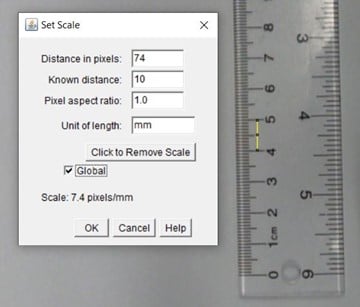
- Select the line tool and draw over 1 cm on the ruler, then go to analyze> set scale, and change ‘known distance’ to 10, and unit of length ‘mm’ (Figure 2).
- Select global so this is applied to all your videos.
- You have to do this every time you reopen Fiji, so if you do your analysis over multiple days remember to set the scale every time!
Analysis Pipeline
Next comes the video analysis [4].
- Open a video and crop it to include only the area in which the fish moves (to reduce the area you need to analyze).
- Reduce the size of the file –remove the frames that do not contain movement information. Go to image > stacks > tools > slice keeper and enter the range of slices that include the fish moving, making sure to change ‘increment’ to 1.
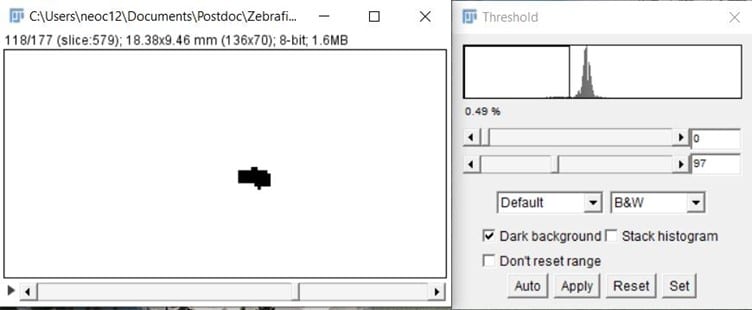
- Change your video into an 8-bit format, then threshold the video (a method of distinguishing an object of interest from the background) so you can only see the zebrafish (it will appear as a small black blob, with hopefully no background – see Figure 3).
- Go to Image > adjust threshold > set the threshold then click apply, in the next window make sure all options are unticked. Now you have a video that is ready to analyze.
For tracking the movement response, I use the ‘TrackMate’ plugin [5] – this should already be installed in Fiji under Plugins > Tracking > TrackMate. Open it and say ‘Yes’ to swapping Z and T (this tells the software that you have data that change over time – T, rather than depth – Z).
The following steps and diagrams will guide you through the analysis procedure.
- Window 1 – calibration settings > skip this section by clicking ‘next’.
- Window 2 – selecting the detection protocol: the default setting of ‘log detector’ is the one to use > next.
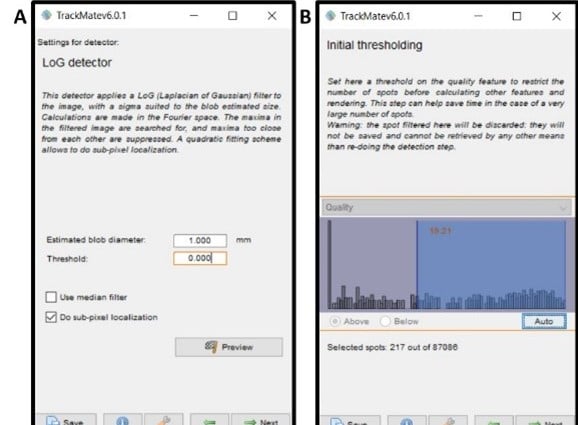
- Window 3 – detection method settings (Figure 4A) – estimate the size of the ‘blobs’ (fish) you want it to detect, a value of 1 mm is a good starting point. To get a more accurate size here you can measure the diameter of the fish using the line tool in Fiji, then analyze> measure for the length and enter that value into this box. Click next twice.
- Window 5 – initial thresholding (Figure 4B) – set parameters for what quality of blob the software will accept for analysis. Clicking ‘auto’ is a good place to start, then by going two screens ahead (click next twice, keeping the view set on HyperStack Displayer) you can scroll through your video and see if there is good inclusion of your fish by the pink selection circles (spots). If there are a large number of other blobs circled, then reduce the amount of data selected in the thresholding box by going back to that screen, and if your fish is frequently not circled increase the data included during thresholding. Once you have a selection of the fish throughout the video, move on to manual and automated editing of spots.
- To edit spots use the instructions on the ‘select a view’ screen (Window 6). Briefly, you can double click a spot to select it (it will go green) and then you can use the key ‘D’ to delete it, or ‘A’ to add a spot to the fish if one is not present.
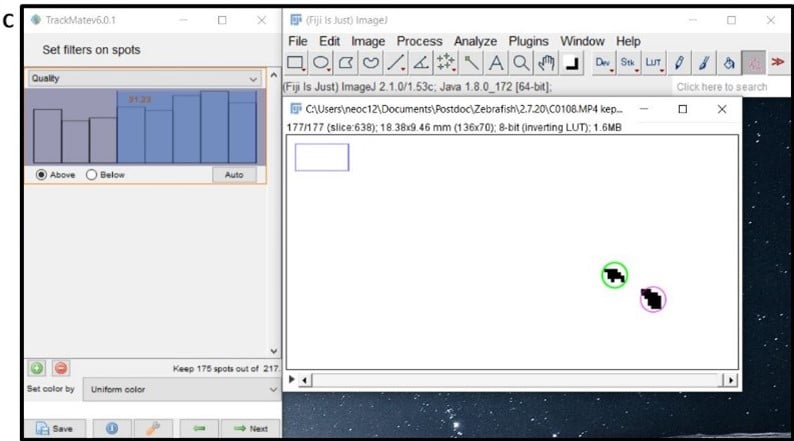
- Window 7- automatically delete spots that are detecting background noise by using filtering criteria as shown in Figure 4C. For example, filter for quality of blob or x/y position, by clicking the green plus icon and then editing the selection criteria. Between this process and the manual editing, you should end up with just your zebrafish selected in each frame of the video. Click next.
- Window 8 – this is the stage where the software links up your spots to track the fish movement – keep the default simple LAP tracker selected and click next.
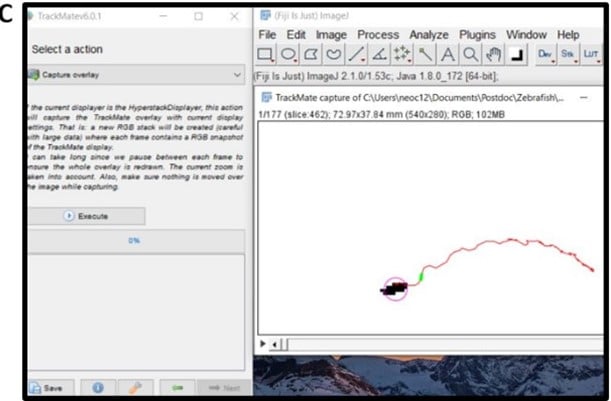
- Window 9 – Figure 5A shows settings for the tracker and refers to the rules the software will follow when linking up the spots. As a starting point, try 5 mm as your maximum linking and gap-closing distances, while keeping the maximum frame gap at 2. You can alter these distances as needed to either include missing spots in the tracking or exclude irrelevant spots.
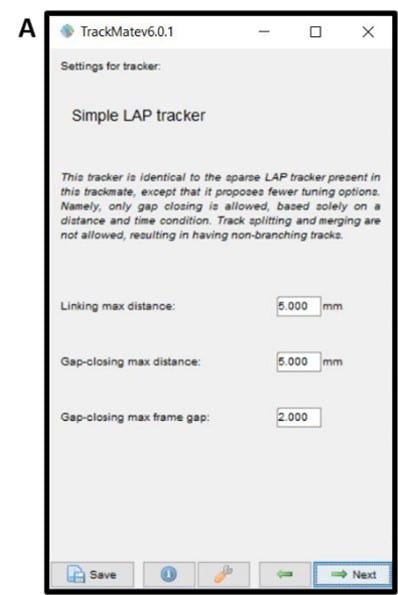
- Window 10 – Figure 5B shows the screen for filtering tracks; use this to edit the number of tracks down to just the one that links your fish between frames for the video duration, e.g. by using the ‘number of spots in track’ filter.
- Now you should have a single track that detects the movement of your fish frame by frame, so click next and open the ‘analysis’ tab to get the measurement data from TrackMate. Copy all the data from the ‘links in tracks statistics’ pop-up into excel.
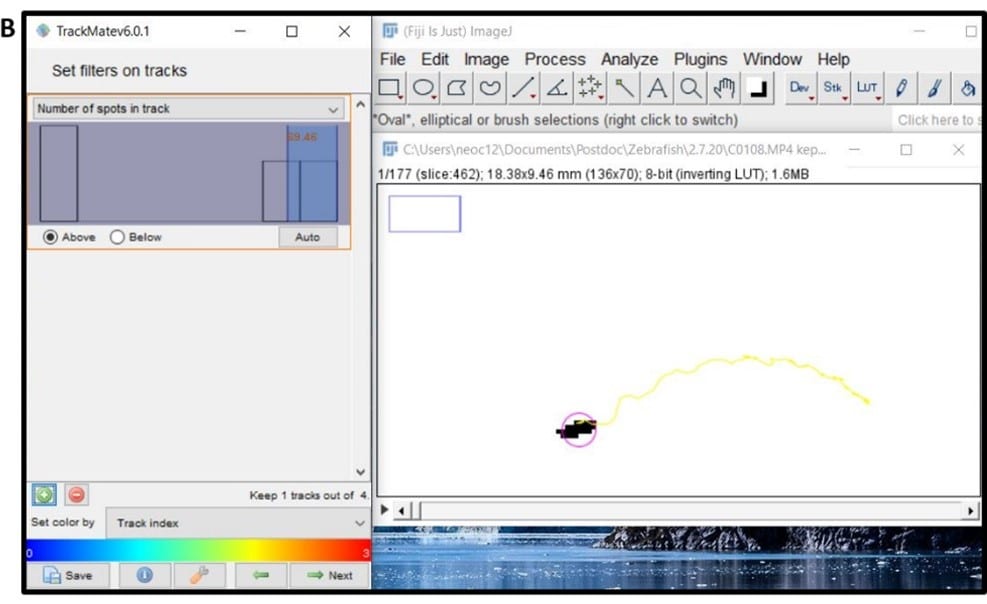
- Click next twice more and then ‘execute’ to produce an overlay image of your final tracking data (Figure 5C), save this file, and then you have all the movement data ready for analysis.
Once you have the data for each zebrafish in excel you can start calculating the movement response.
- Find the column entitled ‘velocity’ and average the values – this gives you the average speed of your fish in mm/s.
- Use the sum function in the ‘displacement’ column to provide the total distance your fish traveled in mm.
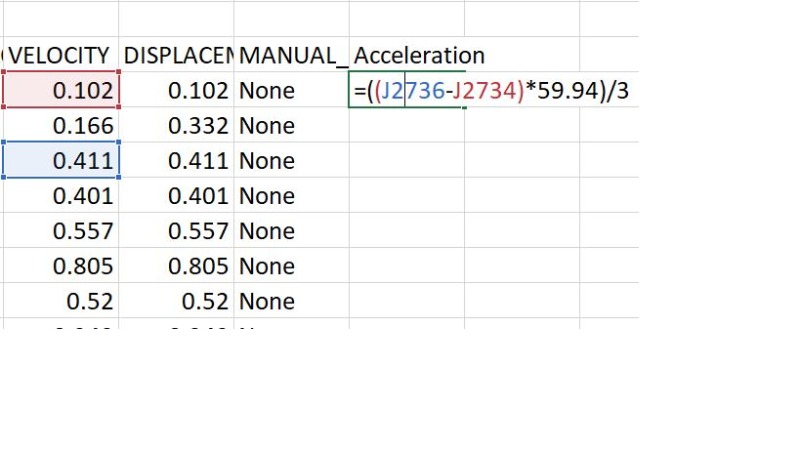
- Finally, acceleration is a useful value to calculate as it is indicative of the force of contraction the fish produced. To calculate this, find the cell in the first few rows of the ‘velocity’ column after which the velocity doesn’t increase anymore (e.g. the values are: 0.1, 0.2, 0.22, 0.25 then 0.1 again – take those first 4 cells). Subtract the first (lowest) value from the highest (last) value and multiply this by the number of frames per second you recorded with, divided by the number of cells the acceleration lasted for. This will give you the acceleration in mm/s2 (Figure 6).
And there you have it – a protocol to measure movement in zebrafish. This test gives you quantitative behavioral data after only 2 days of fish development. You can also use this to track the movement of other small organisms/objects – let us know in the comments if you have adapted it for other conditions!
Looking for more great articles on Zebrafish? Check out these related articles:
Couples Counselling for Zebrafish: How to Optimize Breeding Efficiency
Take a Stab at It! A Guide to Microinjection in Zebrafish
References
- Saint-Amant, L et al. (1998) Time course of the development of motor behaviours in the zebrafish embryo. J Neurobiol. 37(4):622-632. DOI:10.1002/(SICI)1097-4695(199812)37:4<622::AID-NEU10>3.0.CO;2-S
- Sztal, Tamar E et al. (2016) Using Touch-evoked Response and Locomotion Assays to Assess Muscle Performance and Function in Zebrafish. J Vis Exp. 116:54431. DOI:10.3791/54431
- Kalueff, Allan V et al. (2013) Towards a comprehensive catalog of zebrafish behavior 1.0 and beyond. Zebrafish vol. 10(1):70-86. DOI:10.1089/zeb.2012.0861
- O’Connor, E et al (2018) MYO9A deficiency in motor neurons is associated with reduced neuromuscular agrin secretion. Hum Mol Genet. 27(8):1434-1446. DOI:10.1093/hmg/ddy054
- Tinevez JY, et al. (2017) TrackMate: An open and extensible platform for single-particle tracking. Methods. 15(115):80-90. DOI:10.1016/j.ymeth.2016.09.016
You made it to the end—nice work! If you’re the kind of scientist who likes figuring things out without wasting half a day on trial and error, you’ll love our newsletter. Get 3 quick reads a week, packed with hard-won lab wisdom. Join FREE here.


