
Digital images are a fundamental medium through which we communicate science.
And if it’s not been drilled into you enough yet—always make your own.
But it’s a confusing and daunting skill to learn because there are countless file types, dozens of software packages with steep learning curves, and infinite ways to manipulate digital objects to achieve the final results.
Let’s start simple, then.
Choose a free resource to help you move forward
POSTER
Histological Stains Poster
DOWNLOAD
Culture Contaminants Reference Card
This article introduces some fundamental technical aspects of preparing digital images for publication.
We’ll cover common file types you’ll encounter, their properties, and some key concepts you need to understand to start making exquisite figures of your own.
The Two Types of Digital Images: Raster vs. Vector Images
Digital images are classified based on how information is stored.
The two main types of graphics are:
- Raster images.
- Vector images.
Images in raster format are compiled using a specific number of pixels—tiny individually-colored dots that come together to form the complete picture. So, a raster image is essentially a two-dimensional matrix of pixels.
Conversely, vector images consist of objects expressed using mathematical formulae, known as paths. The paths link one point to another to build complete shapes. Graphical Information in a vector image is not stored in pixels.
Check out Figure 1 below for a comparison between raster and vector images.
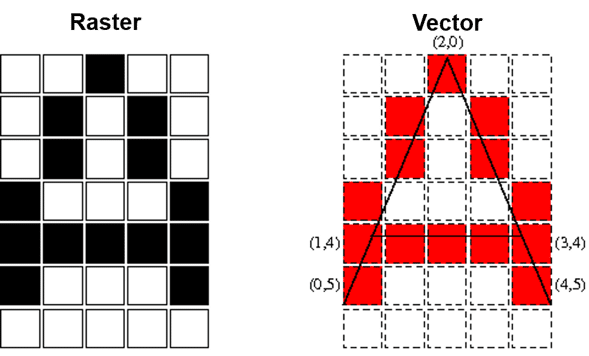
Since the details of vector images are encoded in mathematical paths that remain the same regardless of image size, they can be scaled limitlessly without becoming pixelated (Figure 1).
However, as information is represented in a fixed number of pixels in raster images, there is a limit to which raster images can be enlarged before there is a visible loss of image quality (Figure 2).
But there’s a but.
We normally render (convert) a vector image into a raster image before we use it in a manuscript or on the web, etc. That’s to say, we convert them into a format that cannot be enlarged without loss of image quality.
This is not as confusing as it first seems. It’s simply something we must do because the common file types (JPEGs, GIFs, and so on) are raster file types.
The main corollary to this is if we prepare a vector image, we must render it (convert it into a raster file type) at a size that closely matches our final intended size.
Render it too large, and we will have an unnecessarily large file size.
Render it too small, and the final image will be pixelated and ugly.
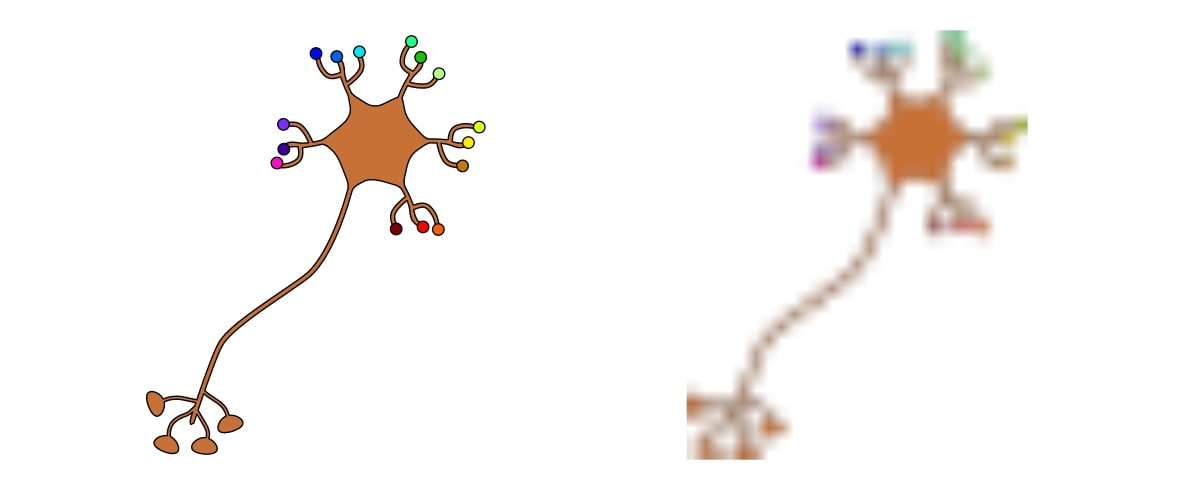
For example, in the image above, the neuron on the left is a raster image rendered at an appropriate size for this web page. The pixels in the image are so small that they are not visible. The details are clearly visible.
On the other hand, the neuron on the right has been rendered at too small a size. It’s been enlarged to match the on-screen dimensions of the neuron on the left.
Consequently, the pixels are visible, and the image looks extremely blocky. It even looks cropped even though it hasn’t been. And most of the details are lost.
This is an example of a low-resolution image.
But the key point is—the original file that contains the neuron image is a vector file. So the neuron could be rendered at the size of a building if we wanted.
That’s a lot of information if you are new to this stuff. So check out Table 1 below for a summary of raster and vector digital images.
Table 1. Summary of raster and vector digital images.
Image type | How information is stored | Fixed resolution? | Scalability |
Raster | Pixels | Yes | Can only be resized to a certain extent before noticeable loss of quality |
Vector | Mathematical formulae | No | Can be resized infinitely without loss of quality |
Common Image File Types and Their Properties
Raster and vector graphics are created from data generated by/in software packages. These could be illustrative software, such as Inkscape or Adobe Illustrator, in which you manually draw things. Or the data can be generated from scientific software, such as that which controls an electron microscope. The light source behind your microscope even shapes that data, too.
Either way, the information needs to be converted into an image file before it can be displayed anywhere. As a scientist, you will need to prepare digital images suitable for publishing in various formats, such as research manuscripts, posters, and the internet. So, here are some of the most common file types you will encounter.
JPEG. Also Known as JPG
The JPEG file type is named after the Joint Photographic Experts (JPEG) Group, which created it.
They are the most common type of compressed image that you will encounter, and compressed just means that the file has had some of the less important graphical information removed to reduce the file size.
JPEGs can store a lot of information in a small file size, but as mentioned, the way they compress graphical data is “lossy.”
This means some of the visual information is lost, and the fidelity of the final image is reduced.
JPEGs are popular for applications where space maximization is important. For example, digital cameras often store images in JPEG format to maximize the number of photos stored in the camera’s memory.
Similarly, websites such as blogs and magazines often use JPEGs to reduce page load times.
JPEGs are usually not recommended for figures in publications such as manuscripts and posters. This is because the information loss during compression may cause the image to be pixelated and blurry when resized.
Note also that repeated saving of JPEG files may also degrade image quality.
TIFF. Also Known as TIF
The Tagged Image File Format (TIFF) is a common uncompressed image file type.
As the files are not compressed, TIFF files retain all visual data. However, they can take up a lot of data storage space!
TIFF files are also extremely versatile when it comes to color. They can be in grayscale, cyan-magenta-yellow-key (CMYK), or red-green-blue (RGB) color models (see later), making them easily editable to suit the requirements of the publication.
TIFF files are also compatible with Windows and Mac operating systems. TIFF images’ flexibility and high quality make them the gold standard for journal publications.
PNG
Portable Network Graphics (PNG) files are raster image files.
Unlike JPEG files, PNG files undergo lossless compression (compression which does not degrade visual fidelity). As a result, PNGs are usually larger than JPEGs.
Like TIFF images, there is no degradation in image quality when PNG files are saved and re-saved.
And the PNG format supports greyscale and RGB color models, but not CMYK.
The PNG format allows pixels to take no color value. That’s to say, you can have transparent space in the image file! This makes them PNG especially suitable for line drawings and illustrations such as graph icons.
Note that some journals accept figures submitted in PNG format.
EPS
EPS stands for Encapsulated PostScript, and it is a graphics file in vector format.
The EPS format is a versatile file type supported by several different drawing and vector editing programs, such as Adobe Illustrator and CorelDraw.
Another advantage of EPS is its compatibility with many different operating systems. As such, EPS is recommended for master image files as they are editable on different platforms without having to fret about compatibility issues.
Being a vector file, it can also be scaled infinitely without losing image resolution.
Although EPS files are still used today, they are increasingly being replaced by newer file formats such as Adobe Illustrator (AI) and Portable Document Format (PDF). In addition to TIFF files, journals may accept image files submitted in EPS format.
And even though EPS files can be edited, the editing process can be difficult because of the age of some editors and may require some knowledge of the PostScript language.
SVG
SVG stands for Scalable Vector Graphics. Because SVG illustrations are vector graphics, they can, like EPS, files, be scaled up to any size.
Developed in 1999, this file type is comparatively new and supported by most graphics software packages.
AI
AI stands for Adobe Illustrator Artwork file.
It shares many of the benefits of vector graphics (scalability, versatility, and easy editing) exhibited by SVG files.
However, the fact that it’s proprietary may be a blessing or a curse, depending on how you work and your final intended application.
|
Type |
Advantages |
Drawbacks |
Good for |
|
|---|---|---|---|---|
|
AI |
Vector |
Proprietary file type developed by Adobe for Illustrator 9. |
Proprietary file type developed by Adobe for Illustrator 9. |
Logos and master copies of illustration files that require editing. |
|
SVG |
Vector |
A popular file type that supports animation and is relatively easy to edit. |
Uncompressed files may be large. |
Master copies of illustration files that require editing. |
|
TIFF |
Raster |
No loss of visual image information. |
Large file size. |
Digital images, photos, and figures for publications that require high-fidelity images. |
|
EPS |
Vector |
Versatile file type which can be scaled infinitely without losing image resolution. |
An old file type that may be replaced by newer file formats. |
Master copies of image files that require editing. |
|
PNG |
Raster |
Relatively small file size. |
Does not support all color models. |
Line drawings, graphs, and icons. |
|
JPEG |
Raster |
Small file size. |
Loss of some visual information. |
Photos for Internet applications. |
Manipulating Images and Converting Between File Types
You can convert image files between the file types.
Now, just to be clear—the process isn’t magic.
You cannot gain any resolution through conversion, nor can you make a raster photo infinitely scalable by converting it to a vector online.
Editors note: Inkscape has a trace bitmap tool that usually does a decent job of tracing a scalable vector outline from photos.
But image conversion is useful if you want to (say) remove the background from a digital image to make it transparent or merge it with several others.
Here are several free and excellent tools to enable you to manipulate digital images online:
- Convert PNG to JPEG and vice versa.
- Convert (almost) anything to anything.
- Merge PDF files into a single contiguous document.
- Bulk resize photos.
- Rotate images.
- Remove white backgrounds from images to make them transparent.
- Crop and resize photos.
Key Concepts in Graphical Illustration
Before you download some software and crack on making beautiful images, let’s take a moment to understand some basic concepts so you can improve and optimize your illustrations. If you’re moving to whole-slide workflows, see why you need digital pathology and how to choose the best camera for it.
Resolution
Simply put, resolution is the amount of detail represented in an image.
For a raster image, resolution is defined by its dimensions (width by height), since this in turn defines the total number of pixels.
So, image resolution is usually expressed in pixel width by pixel height, the same as screen resolution.
Sometimes, resolution is expressed as the physical dimensions of the image. For example, 6 cm by 12 cm. When creating an image, you can choose if you want to work in units of pixels or length.
And note that the resolution that an image is initially rendered at is called its native resolution. Enlarging a raster image beyond its native resolution will make it look pixelated, like in Figure 2.
Scaling a raster image below its native resolution should be fine, but it can lead to some image artifacts depending on the magnitude of the scaling and the software/algorithm used to do it. So keep your eyes peeled.
Dots Per Inch (DPI)
Dots are akin to pixels, but they are not the same. Don’t worry about the differences for now. Just appreciate that dots and pixels are related by the size and resolution of your monitor.
The more dots in the image per unit area, the higher its resolution. Imagine an image made of 300 dots compared to the same one made of 72 dots.
More details will be present in the image comprising 300 dots compared to one with 72 dots.
As a result, an image with a higher resolution will appear sharper and with greater clarity than one with a lower resolution.
And an image with a higher DPI can also be enlarged to a greater extent than one with a lower DPI before a discernible loss of image quality occurs.
If there are few dots in an image, extensive increases in image size will cause each pixel to become large and noticeable, as in Figure 2.
At what DPI should you render your digital images?
That will depend on the complexity and size of the image as well as the distance from which the image is viewed.
A DPI as low as 30 dpi is sufficient for printed images viewed from a distance, such as billboards. Images viewed from a closer distance should be rendered with a higher DPI.
As a rule of thumb:
- For web applications, the DPI should be ~70.
- Images destined to be printed in a journal should be 300-600 DPI.
Journal guidelines will differ, so be sure to check them.
Note also that the optimal DPI value depends on what’s in your image! A picture of a uniformly blue sky will look great irrespective of low DPI settings.
However, a colorful and detailed fluorescence micrograph will lose its detail if rendered with a low DPI.
Higher DPIs will also increase the file size. So consider how you might transfer your digital images if they become particularly large.
And the main point is—don’t fret about any of this! Your graphics software knows the size and resolution of your display and will convert DPI to pixels to cm automatically.
Color Model
Colors are weird.
How they are generated, mixed, and perceived depends on where they are displayed and the way they are generated. How colors are generated is called a color model.
There are three color models you need to be aware of:
- RGB.
- CMYK.
- HSV.
They are all different mathematical ways of modeling colors. Want an example of their differences?
In the RGB model, red and yellow combine to make green. And combining all the primary colors (red, green, and blue) makes white.
Try mixing red, green, and blue paints—you won’t get white. As I say, colors are weird.
Don’t worry about their differences for now, just note:
- The RGB model is used for screen displays.
- The CMYK model is used for color printing.
- The HSV model is the most accurate with respect to humans perceiving colors.
You can read more about color models in this post.
File Size
Images are a way of representing data. This data will take up memory on any storage device. How much memory depends on several factors, such as:
- The file type.
- Compression.
- Image resolution.
Keep the intended destination and application of your illustrations in mind when creating or collecting them!
The file size also impacts how you transfer images. Some email providers limit attachments to ~30MB
And spare a thought for people who work at microscopy and synchrotron facilities—raw micrograph and diffraction images can take up TBs of space and have to be transferred by File Transfer Protocol (FTP).
Journal Image Requirements
Look up the graphical image requirements of your intended journal before you start illustrating! They will probably specify:
- File type.
- File size.
- Color model.
- Resolution.
It pays to know these things from the outset. That’s why we’ve covered them in detail.
Digital Images for Publication in Summary
We’ve covered loads there. We’ve compared and contrasted the two main types of digital images, looked at the pros and cons of major file types, and covered key concepts involved in the graphical illustration of your data.
Plus, you’ve got a heads-up on what requirements journals expect your figures to meet!
Some of these concepts are a bit abstract, so leave your questions in the comments section below.
And if you want to improve your figure-making further, check out this article on drawing beautiful protein structures in PyMOL™ and read this article to get started making simple illustrations.
Happy drawing!
Originally published in July 2019. Revised and updated in February 2023.
You made it to the end—nice work! If you’re the kind of scientist who likes figuring things out without wasting half a day on trial and error, you’ll love our newsletter. Get 3 quick reads a week, packed with hard-won lab wisdom. Join FREE here.


