
If you want to get the maximum yield and quality from your next-generation sequencing experiment then you are going to need to make sure each of the libraries you produce is carefully quantified ready for pooling and/or loading onto a flow cell. If the quantification goes wrong you’ll get a bad balance of samples within your pool, and if the loading goes wrong you might get no data at all!
There are three places you really need to consider careful quantification in next-generation sequencing workflows: your input DNA/RNA, mixing libraries to create multiplex pools, and flow-cell or PGM-chip loading. I’m going to focus on the last two in this article as there are many ways to quantify NGS libraries but the best method, and the one recommended by both Illumina and Ion Torrent, is quantitative real-time PCR (qPCR). It is worth the effort to get the most accurate quantification possible in order that you get reliable clustering – underestimate and you will get lower than expected numbers of reads, overestimate and you can get lower quality sequences, or even none at all!
In this article I’ll explain the pro’s and con’s of using qPCR and also discuss some of the other methods people use; these come with an advisory warning to avoid unless you really understand their limitations!
Quantitative Real-Time PCR
The usual methods for nucleic acid quantification have several limitations: both gel electrophoresis and spectrophotometry measure total nucleic acid concentrations, including non-amplifiable DNA. Quantitative real-time PCR is the preferred method for quantifying NGS libraries as it only quantifies amplifiable molecules, is more sensitive, uses less sample and can be very high-throughput.
Choose a free resource to help you move forward
EBOOK
Gene Editing 101
DOWNLOAD
Blood Collection Tube Chart
Illumina recommends the very capable KAPA library quantification kit, but there are alternatives including Agilent, Qiagen and QuantBio, among others. The KAPA kit is a SYBR-green assay that includes qPCR primers designed to the adapters ligated at the ends of Illumina NGS libraries, and a dilution series (six 10-fold dilutions) of a 425 bp oligonucleotide control template. Your libraries are run alongside this control as a relative quantification standard and the Cq (quantification cycle) data are used, along with the average library fragment size, to determine molarity.
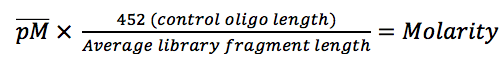
This last point is an incredibly important, but all too often overlooked one. If the library fragment size is inaccurate then the molarity calculations will be similarly inaccurate – this is the major downfall of current qPCR kits. A look at the calculation below makes this clear: multiply the average pM (pico molar) concentration from a triplicate qPCR by 452 divided by the average library length to get actual molarity. If the estimate of average fragment size is too high then molarity will be under-estimated and you will over-cluster reducing yield and quality; if the estimate is too low then molarity will be over-estimated and you will under-cluster reducing yield. Similarly with multiplex pooling, if libraries have varying fragment size then the molarity calculations might lead to an imbalance between samples.
Improving Your NGS Library Quantification
You can make some simple changes to the way you work to improve your quant.
- Replication: Replicating your qPCR setup reduces the impact of poor pipetting. You’ll only use 1 ?l of your library in each reaction and any under- or over-pipetting can affect molarity similarly to poor fragment length estimation. We would always run triplicate qPCR before loading onto a flow cell, and we’d repeat the whole experiment if the replicates were not good.
- Pool larger volumes: Once you’ve got molarity calculations and are ready to mix libraries to create a multiplex pool pipette larger volumes. You’ll get much more accurate pools by pipetting 3 ?l and 3.3 ?l together than 1 ?l and 1.1 ?l.
- Learn from your quantification: If you consistently get high-yield libraries (>100nM), then you are almost certainly running more PCR cycles than necessary. Aim for 10–100 nM by reducing the number of PCR cycles and you should see a drop in PCR duplicate reads. Only 20pM of library goes onto a HiSeq flow cell!
Other Quantification Methods
Warning – be careful about using these as an easy substitute for qPCR. Don’t take shortcuts at this stage! For those wanting to know more, you can quantify NGS libraries using fluorimetry, Agilent BioAnalyser gel electrophoresis, and even spectrophotometry – however these methods all measure total nucleic acid concentrations, including non-amplifiable DNA. As such they can provide inaccurate results.
Qubit
The Qubit uses intercalating fluorescent dyes and will quantify any nucleic acid present in your sample. The Qubit is a good substitute for qPCR if you are pooling libraries that you expect to be very similar, i.e. all prepared at the same time from high-quality DNA or RNA. But it can over-estimate your library concentration if the adapter ligation is inefficient. You will also need to convert from ng/ul to nM (nmol/l) which you can do using the following equation:

BioAnalyser
The Agilent BioAnalyser can be used for quantification, but it does need to be used within its quantitative range and you must manually integrate or assign regions for the quantitation to be performed. This can be very subjective, so only attempt this if you are confident about how you are using the BioAnalyser.
Nanodrop spectrophotometry
We would never recommend the nanodrop for quantification as all nucleic acids in your sample, including primers and nucleotides will contribute to the readings. However the Nanodrop is convenient for checking the approximate concentrations and purity of your NGS libraries or samples. Libraries with poor 260/230 and/or 260/280 ratios may interfere with sequencing and you should consider an additional library cleanup with SPRI beads.
You made it to the end—nice work! If you’re the kind of scientist who likes figuring things out without wasting half a day on trial and error, you’ll love our newsletter. Get 3 quick reads a week, packed with hard-won lab wisdom. Join FREE here.


