At first sight, qPCR looks like a very simple technique, and when it’s optimized, it can lead to great results.
However, to obtain consistent and accurate results that reflect what is really going on in your sample, good controls are crucial for great qPCR data.
One of these key controls is the qPCR standard curve. This enables you to check the efficiency of your primers.
Efficient Primers Are Important for Great qPCR Data
Designing and testing the qPCR primers using a standard curve is an absolute must before doing any qPCR experiments! Making sure that the obtained Ct values are valuable and reflect reality is important.
After you receive your new primers, you’re often impatient to run your qPCR to obtain new results. But if you avoid testing the primers first, then you might obtain false results and lose a lot of time. A risk no researcher wants to take.
Whether you design the primers with bioinformatics software, come to Bitesize Bio for help, or choose a sequence already published, you can’t guarantee your primers are good. Even if the melt curve results in a nice, clean single peak, it does not indicate that the oligos are usable. They still may not amplify the target efficiently during a dose-dependent DNA amplification.
Therefore, you should always test your primers with a qPCR standard curve. The qPCR standard curve ensures that your primers bind to and amplify their target efficiently and precisely, which is critical.
How to Perform a qPCR Standard Curve
To perform a qPCR standard curve, you set up qPCR reactions to amplify different amounts of the same DNA sample. Theoretically, efficient primers will result in a proportional dose-response curve.
To get a good standard curve, you ideally need at least five data points over several orders of magnitude (5- to 10-fold dilutions).
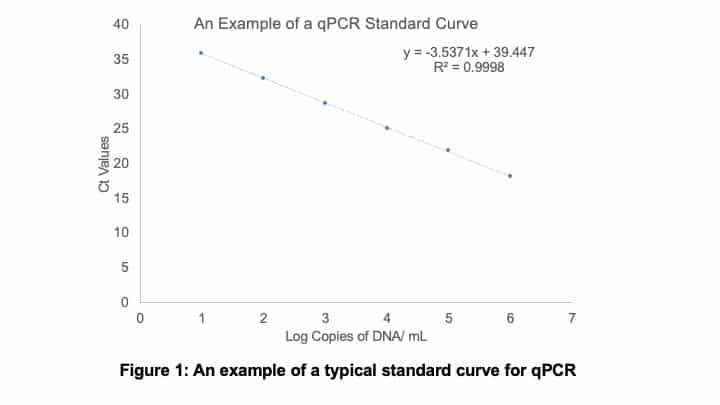
You then need to plot your obtained Ct values on the y-axis, and the number of log DNA copies per mL on the x-axis. An example of a standard curve is shown below in Figure 1.

You also want to run samples in triplicate, so you can assess the repeatability.
To obtain precise results, do sequential dilutions and pipette the same volume of DNA in every reaction. Use water instead of DNA as a negative control to detect contaminants in the reaction and to discriminate background amplification.
Also, make sure your DNA sample is good quality (intact DNA, appropriate concentration, and a good 260/280 ratio).
Analyzing Your Standard Curve
Some qPCR software has applications to analyze your standard curve. It generates the curve and calculates the efficiency of the reaction. There are a few values you want to calculate and assess when analyzing your curve.
PCR Efficiency
What do we mean when we talk about PCR efficiency? Under ideal conditions during PCR, the number of DNA molecules should double every cycle. This would give 100% efficiency, which is what we are trying to achieve. Reactions are rarely perfect so, acceptable ranges of efficiency are between 90 and 110%.
You might be thinking, whoa, how can you have an efficiency of over 100%? It is possible and usually indicates polymerase inhibition. This inhibition will be strongest in the least diluted samples. As the samples are diluted, the concentration of inhibitors decreased (because of dilution) and this can lead to efficiencies over 100%.
If you do see efficiencies of over 100%, try diluting your samples more or not including the higher dilutions in the efficiency calculations.
For values below 90%, you may have inhibitor contamination or poor primer efficiencies.
How to Calculate PCR Efficiency
Much qPCR software will calculate PCR efficiency for you, but if you want to calculate it yourself, then you can use the following equation:
E=(10^{\frac{-1}{slope}})-1To get the percentage efficiency, just multiply the number by 100.
The R2 Value
The R2 value is the coefficient of correlation and should be > 0.99 to provide a good confidence within the correlation.
This value lets you see if there is a good linear relationship between the values of each sample. A low value could indicate a poor serial dilution. To avoid this, when making your serial dilutions ensure you pipette accurately, using well-calibrated pipettes, and mix dilutions well.
How to Calculate The R2 Value
To calculate this value manually, plot a graph with the log of each sample dilution against the average Cq value. Excel will calculate the R2 value, which you can see by ensuring ‘Display equation on chart’ is selected in chart options.
Standard Deviation for Cq Values
Performing replicates helps reduce errors and makes your R2 and PCR efficiency values more reliable. However, you won’t get reliable values for these if your replicates vary too much.
To check how reliable your replicates are, calculate the standard deviation (SD). Good replicates should be within 0.2 SD units. If they are not, you may need to redo your standard curve.
If you get nice data from your qPCR standard curve, you are well on your way to you being satisfied with the efficiency of the primers! But what happens if your standard curve data is not so good?
What If Your Primers Are Not Efficient?
It happens surprisingly often that the qPCR standard curve results in an unproportioned curve; each DNA concentration results in approximately the same Ct value. This means that the primers do not recognize the target efficiently.
If this happens to you, first, make sure your DNA sample is clean and does not contain contaminants. If your primers still do not amplify efficiently, then design and order a new pair of primers.
In the past, I have tried to troubleshoot inefficient primers to find the appropriate parameters (primers concentration, annealing temperature, etc.). In my opinion, it rarely leads to good results.
A Bad qPCR Standard Curve May Reflect Low DNA Expression
A poor standard curve may not be caused by inefficient primers. Your standard curve might be incorrect if your target is expressed poorly in your sample. You should verify whether this target is expressed in the cell type that you’re studying. If your target is poorly expressed, increase the quantity of DNA used for the amplification.
Alternatively, you could do a pre-amplification step to increase the expression of your target, for which commercial kits are available. (1) You can also do your qPCR on crude cell lysates instead of purified RNA samples to avoid losing material. (2)
Advantages of a qPCR Standard Curve
Besides knowing if your primers are efficient, a standard curve tells you the detection limit. This can help you determine the appropriate amount of DNA to use in your next experiments. Why use 10 ng per reaction when you can get good amplification at 1 ng? That way you can spare your precious DNA samples for more qPCR reactions!
In summary, it might be tempting to skip the qPCR standard curve step but I hope I convinced you how important it is to take the time to evaluate the efficiency of your new primers. Taking the time in the start to ensure your primers are efficient can save a lot of time in the long run and ultimately lead to better results!
For a more comprehensive guide to PCR, download our free PCR fundamentals eBook and become an expert.
Check out our related article for some considerations for determining qPCR efficiency.
Originally published November 2016. Reviewed and updated June 2022.
References
- Korenkova V, et al. (2015) Pre-amplification in the context of high-throughput qPCR gene expression experiment. BMC Mol Biol. 16:5.
- Van Peer G, Mestdagh P, Vandesompele J. (2012) Accurate RT-qPCR gene expression analysis on cell culture lysates. Sci Rep. 2:222.


