Welcome to the magical world of systematics!
Looking for a way to produce a phylogenetic tree that’s a step above the default options, time efficient, not too program heavy and avoids using command line programs? Although there are more rigorous analyses that strict systematists perform, for your purposes, the following should suffice.
1. Data selection – Amino acid or nucleotide
In the case of a gene phylogeny, you need to decide if you want to work with nucleotide or amino acid data.
You can use either amino acid or nucleotide data to generate a tree.
Some argue that it is better to use amino acid data because the redundancy of the genetic code means your will be able to recover more conserved sites in your alignment. However, any analysis you perform with amino acid data is more time consuming in comparison to its nucleotide counterpart. This is because there are 20 possible amino acids substitutions, as opposed to only 4 nucleotide substitutions. Models of evolution estimate substitution rates for each site: because there are more possible amino acids substitutions, the analysis will take longer to perform.
Other scientists prefer to use nucleotide data. As mentioned above, nucleotide analyses are faster. In addition, nucleotide data has more information that can be used to recognize the evolution of your sequence since 3 nucleotides code for 1 amino acid. To preserve the codon reading frame you would first align your amino acid data in MESQUITE and then “force” your nucleotide data to align to the corresponding amino acids.
2. Alignment – MAFFT and MUSCLE
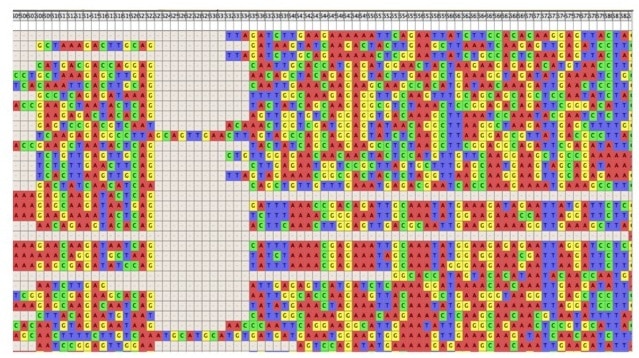
Alignment has been described as “the most difficult and least understood component in phylogenetic analysis” (Swofford et al. 1996). Alignment programs shift your data by inserting gaps to line up all the homologous (or conserved) sites into vertical columns. There are many alignment programs out there and without going into too much detail on how or why, two programs of the most common and well-supported are: MUSCLE (MUltiple Sequence Comparison by Log-Expectation) and MAFFT (Multiple Alignment using Fast Fourier Transform).
For new users I recommend using the MAFFT iterative refinement strategy over MUSCLE for the following reasons:
- MAFFT consistently outperforms MUSCLE in recovering more homologous sites
- The server’s website suggests alignment parameters based on your data
- The types of parameters you can adjust to optimize your alignment are clearly laid out
It is best to try at least 2 different parameters, if not more, and then view your alignment to determine which is better (i.e. which parameter settings recovered more aligned characters?).
A good program for visualizing your alignment, and converting it into different file formats (e.g. Nexus, PHYLIP, etc.) is Mesquite.

3. Model Selection
Your phylogenetic tree will be more accurate when you use the correct model of evolution. Models consist of various parameters that calculate the substitution rates of your data. In other words, a program predicts which model’s algorithm best captures the way your data set is evolving or changing. This model is used later to build your tree.
When using nucleotide data, use jModelTest. For amino acid data, submit your jobs to the ProtTest server. For both, response time will vary depending on the quantity and divergence of your sequences.
Once the model test has been performed, look at the output and select the model with the lowest AIC (Akaike Information Criterion) and/or BIC (Bayesian Information Criterion). The lower AIC/BIC value means less data is predicted to be missing under this specific model. Remember, data is ALWAYS missing from your analysis because you have not included all genes/species in existence, and because of extinction events there is data we can never obtain.
4. Tree building
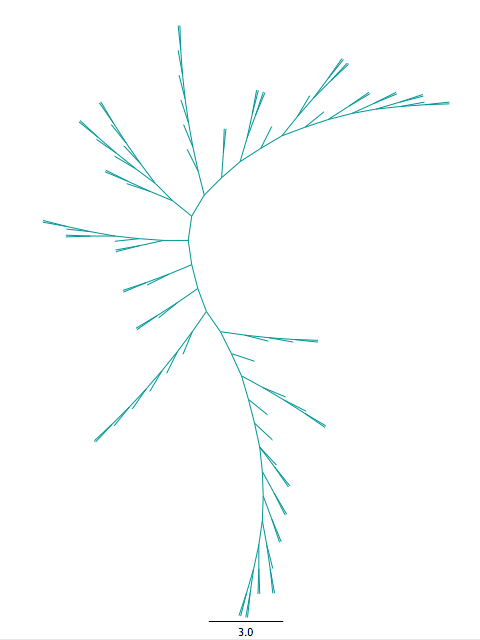
Maximum likelihood (ML) assumes the best tree is the tree that is most likely with the given data, under a certain model. ML will take into account all the data you’ve generated so far (your taxa, the alignment and the model) in order to construct your final tree. It is a commonly used tree-building algorithm that will give you a single tree as your output.

There are several programs that will perform a ML search and the differences between them are usually negligible.
Possible ML servers with interfaces to submit your job:
Many of you have probably heard the term bootstrap, but aren’t quite sure what it means. When you enter the number of “bootstraps” you want performed, you are essentially telling the program how many times you would like your data to be resampled and a new tree constructed. We call these new data sets “pseudoreplicates”.
If you choose “1000 bootstrap” the program will create 1000 pseudoreplicates of your original alignment, and generate a tree for each pseudoreplicate. If a clade is recovered in all of these pseudoreplicate trees then it will appear in your final tree. If a clade is not recovered then it will be collapsed and appear as a “comb” or polytomy. The value above each node represents the percentage of times that clade was recovered in all of your pseduoreplicates.
1000 bootstrap replicates is a common value used in analyses, and has evolved from a trend to an almost standard. In reality you could perform 1 million times bootstrap on tree, but that does not make your tree more reliable. A poorly aligned data set and/or badly constructed tree can still give high bootstrap support. A rule of thumb is to collapse any clades that have less than 50% bootstrap, as this clade is not well supported since it is recovered in less than half of your bootstrap analysis.
5. Making it pretty
Viola! You’ve created your dream tree! Now it’s time to make it publication ready.
To visualize, re-root and perform minor edits to your tree, use FigTree. Remember: the main purpose of the root is to show the direction of evolution, and demonstrate that your gene(s) of interest are related to the in-group.
If you need to change the taxa names, font, or size, use Adobe Illustrator or a similar image manipulation program. Make sure your taxa names can be clearly read and the bootstrap values are visible above each node.
Not all data will require such robust analysis. But you will not know for certain how much better or different a tree produced from a more robust analysis will be until this analysis is performed.
So make sure you branch out and give it a try!
For additional resources see “The Phylogenetic Handbook: A Practical Approach to Phylogenetic Analysis and Hypothesis Testing”, edited by Philipe Lemey, Marco Salemi and Anne-Mieke Vandamme.
References
1. Swofford DL, et al. (1996) Phylogenetic Inference. In Hillis DM, Moritz D, Mable BK, editors, Molecular Systematics, pp. 407-514. Associated, Sunderland, Massachusetts.


