Tracking a cell’s fate
Have you ever wondered what a cell’s life is like? Do they constantly communicate to each other or do they just go on their own daily business? Biologists have long been looking for ways to keep tabs on the cells they are interested in studying. It turns out the easiest way to study their whereabouts is to “color” them! I know, you might be shouting out bioengineering green fluorescent protein (GFP), and that’s certainly a great way to do it, but there is an easier way. It involves super advanced molecular “crayon” technology.
Carboxyfluorescein succinimidyl ester (CFSE) is a “live” cell tracker dye that does not cause the cells harm. Once it enters a cell, it is converted into an active form and becomes impermeable to the cell membrane, trapping it inside. It is a great tool for tracking the cells of interest using flow cytometry.
For example, researchers often use CFSE-labeling in different models so they can easily distinguish the cell populations that are transferred in for study. As individual CFSE-labeled cells divide, the CFSE fluorescence intensity is halved, enabling you to estimate the number of times a population of cells have divided, up to a point where the intensity is no longer detectable. Today, I am going to tell you a different way to use CFSE to measure an immune response.
What in the world is CTL assay?
It turns out that you can be even more creative than using CFSE-labeled cells to look at cell divisions. If you label two different cell populations with different concentrations of CFSE, mix the two populations, and introduce them into a host, you can monitor the cell-specific killing of the targeted populations.
Why do we want to measure cell-specific killing?
Cytotoxic T lymphocyte (CTL) response is essentially a way to look at the overall strength of an immune response to an infection. For a long time, people have used radioactive isotopes such as chromium (51Cr) to label the target cell populations in order to monitor the CTL activity. This traditional method is very time-consuming—not to mention that radioactivity is always a safety concern, an environmental hazard, and all around best avoided where possible!
Step 1. Immunization of hosts to jumpstart the CTL response
As CTL response can only be measured during an active immune response, it is important to give your system a jump-start! Immunization in advance of starting the experiment will initiate the immune response, increasing the number of immune cells present and boosting their activity. This can be done using pathogen-specific peptides. Typically the CTL response should peak 1 to 2 weeks after immunization depending on the pathogen used, which is the best time window to assess CTL response
Step 2. Isolation of the donor cells for CFSE labeling
The donor cells are typically isolated from the spleen of a non-immunized host. Usually cells from the spleen are abundant and easy to isolate compared to other organs. After that, the total number of cells is counted so you have an approximate number of cells that you are working with.
Step 3. Peptide-presentation of the donor cells
The first population of donor cells is treated with pathogen-specific epitopes, which are small stretches of peptides that can be recognized by pathogen-specific CTLs in the host. Another population of donor cells is pulsed with a non-specific peptide that does not belong to the specific pathogen under investigation, acting as a negative control.
Step 4. CFSE-labeling of the donor cells
The two cell populations are incubated with different concentration of CFSE (i.e., CFSE high and low populations). The CFSE “high” population should contain 10 times more concentrated CFSE than the “low” population in order to ensure they are easily distinguishable.
Step 5. Adoptive transfer of the donor cells
The two CFSE-labeled populations (“high” and “low”) are mixed at 1:1 ratio and introduced into the hosts that have been immunized with the pathogen.
Step 6. Harvesting of the cells and flow cytometry analysis
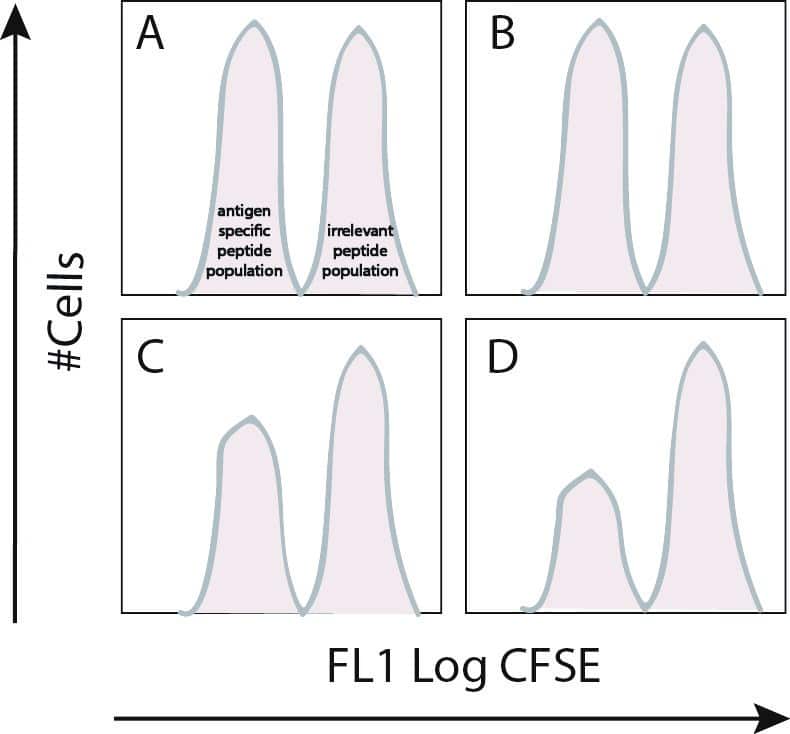
After about six to eight hours (to minimize the amount of cell division!), the spleens are collected from the immunized hosts and the proportions of the CFSE “high” verses CFSE “low” target cells are analyzed by flow cytometry. Figure 1 illustrates what a typical FACs analysis plot would look like.
Step 7. Calculating the percentage of specific killing by CTLs
The final step involves calculating the specific killing by CTLs; in order to do this, the relative ratios of donor and control cells identified in the host need to be calculated and filled in to the equation:
Percent specific lysis=[1-(Non-transferred control ratio/Experimental ratio)] x 100

Figure 1. In vivo CTL assay. CFSE-labeled populations are harvested after six to eight hours inside a host and flow cytometry is performed immediately. A) Non-transferred control. B) PBS-immunized control. C) Immunized control specific to peptide 1. D) Immunized control specific to peptide 2.
These 4 panels tells you that there is strong CTL response generated towards pathogen-specific peptides 1 and 2. The CTL response is pathogen-specific because the donor populations presented with a non-specific peptide has the same magnitude in peak-size as the non-transferred and the PBS-immunized controls.
Although there are many different assays designed to monitor CTL response, CFSE labeling is by far the easiest and most cost-effective way. The main advantages are economy, efficiency, and ease of use. If you are interested in knowing more about various types of CTL assays check out the links below!
References:
- Sheehy, M. E., A. B. McDermott, S. N. Furlan, P. Klenerman, and D. F. Nixon. “A Novel Technique for the Fluorometric Assessment of T Lymphocyte Antigen Specific Lysis.” Journal of Immunological Methods 249, no. 1–2 (March 1, 2001): 99–110.
- Quah, Benjamin J. C., Danushka K. Wijesundara, Charani Ranasinghe, and Christopher R. Parish. “Fluorescent Target Array Killing Assay: A Multiplex Cytotoxic T-Cell Assay to Measure Detailed T-Cell Antigen Specificity and Avidity in Vivo.” Cytometry Part A 81A, no. 8 (August 1, 2012): 679–90. doi:10.1002/cyto.a.22084.


