Take a look at the dotplot below, are you happy with the way it’s presented? Do you think that you could recreate that experiment? If you were a reviewer, would you accept that figure?

Sure, it’s flow plot, it shows 3 populations of which two are gated. Read many journals and you will see data displayed like this. However, the way this data is presented can lead to misinterpretation of the data and makes it very difficult to recreate the experiment. Here are 5 ways that the presentation of this data could be better.
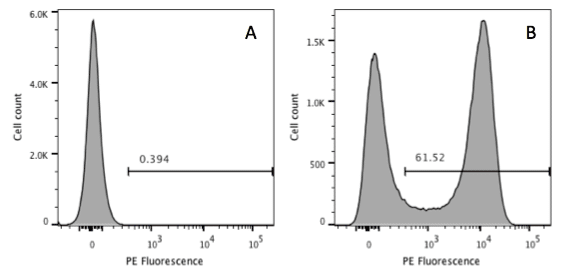
- Log or Linear?
Looking at the plot above, it’s difficult to interpret the data as it doesn’t say whether the data is displayed using a linear or logarithmic scale. The likelihood is that it is a log scale, but without the tick marks and corresponding numbers we can’t be certain.
- Fluorochromes?
The axes above are labelled with the antibody used to identify the antigens on the cell surface, but in order to interpret this data and recreate the experiment, we need more information. Differing fluorochromes have different levels of signal-to-noise and brightness. For example PE and APC are much brighter fluorochromes than FITC or Pacific Blue, so you could get very different results to your experiment depending on fluorochromes.
- Lasers and Band-Pass Filters?
Different lasers can excite fluorochromes and the band-pass filters in machines can be different. Sometimes they vary by only a couple of nanometres, but that might be the difference between reproducing an experiment with a low expressed marker or not. Without knowing the lasers and band-pass used, we wouldn’t be able to recreate the experiment. For example, PE can be excited by a 488nm laser but is better excited by a 561nm laser. Sometimes you will see in papers axis labelled as ‘FL1’ FL2’. This is doesn’t tell us anything about the lasers or band-pass filters used. You can try to guess, but a lot of cytometers are custom made and, therefore, will have specific filters and these should be listed. An axis should be labelled with both the laser type and band-pass filters used, for example: ‘PE-CY7 780_60 561nm.’
- What’s in the gate?
This example does show the different cell populations but it doesn’t reveal how many cells are in each of these gates. It is important to provide a quantitative statistic for your gate, such as percentage or MFI. See the Bitesize Bio article on how to place your gates.
- Cell number?
It can be really helpful to show the user how many total events are on the plot. This allows the reader to interpret results in relation to number of cells. Adding a gating scheme in Supplementary Information is also helpful for the reader to interpret the results.
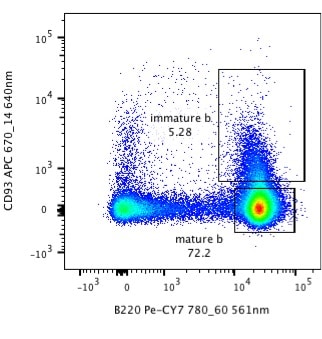
Now, look at the figure below. It is exactly the same data, but I am sure you will agree that is much easier to interpret the plot even without a figure legend. We are given the vital information about the staining, the lasers, and band-pass filters used and the percentage of cells in the gates. Knowing that there are nearly 90,000 events shown on the plot also makes it easier to interpret the data.
So take a look at your flow experiments and, when presenting them, think about what information you can easily give people to allow them to recreate your experiment.