A flow cytometer collects the events you are interested in, and also ‘sees’ every event that goes through. This includes debris and even bits in your buffers. As cytometrists, we gate our cells to exclude unwanted bits and to focus on the sub-populations that we are interested in studying. There are two main ways of gating your cells: hierarchical and Boolean gating.
When selecting the cells of interest from your sample, you might choose hierarchical gating or Boolean gating. This depends on the cytometer you use and the question you are asking. The old school Cell Quest and Cell Quest Pro software of a BD FACSCalibur is an example of a cytometer that used Boolean Gating. However, cytometers such as BD Fortessa use Hierarchical gating. Although hierarchical gating might be of most use, there are times when Boolean gating is useful.
So what is the difference?
Hierarchical Gating
This is the usual default on your cytometer and post-acquisition software. This type of gating uses parent and child gates, and the gating criteria of the parent gate is passed on to a child gate. The parent gate can contain one or more child gates. The use of hierarchical gating reduces the number of gates that are created (compared to Boolean gating).
Boolean Gating
Boolean gates are also known as logic gates. They were named after 19th century mathematician George Boole, who worked on algebraic system of logic. Boolean gates allow gating of populations of cells based on ‘AND’, ‘OR’ and ‘NOT’ logic. This can be useful for finding cell populations that express antigen a and b, but not c.
Boolean gates are useful when sorting cells stained with multiple fluorescent probes. For example, if you have a complicated hierarchical gating scheme, it can be useful to add in a ‘NOT’ gate. This is to make sure that you are sorting only the cells that are of interest to you. You can also add Boolean gating to your hierarchical gates when looking for rare sub-populations, stained with multiple dyes.
For example, in a 7 color experiment, in which you want to sort cells that are FITC, PE or APC positive, Boolean logic can be added to the hierarchical gating. Use hierarchical gating for FSC vs SSC, single and viable cells. The Boolean logic will then sort cells if they are either FITC, or PE, or APC.
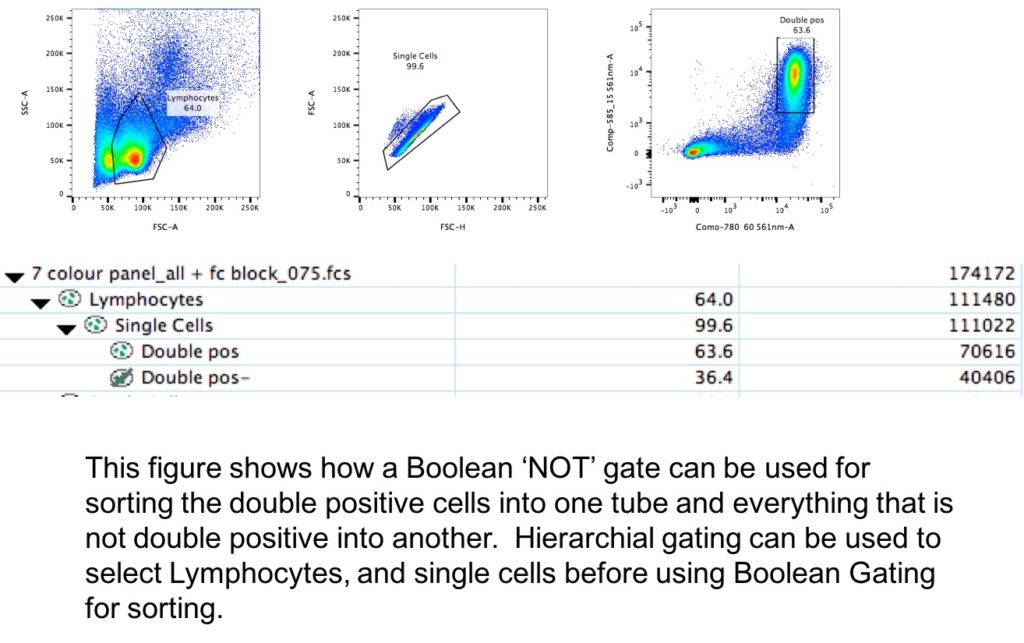
In the sorting example shown below, we have used a combination of hierarchical gating to remove the doublets, dead cells and debris. Then we separated out the double positive cells into one tube and everything else into another tube. So we use Boolean gating to create a ‘NOT’ gate to sort single, viable cells that are either expressing all of the markers or are negative for both markers.

So, if you are used to the default hierarchical gating, why not have a play with your data and see if you can get different or better results using Boolean gating? Or a combination of both?


