

What Is Optical Mapping and How Is It Used?
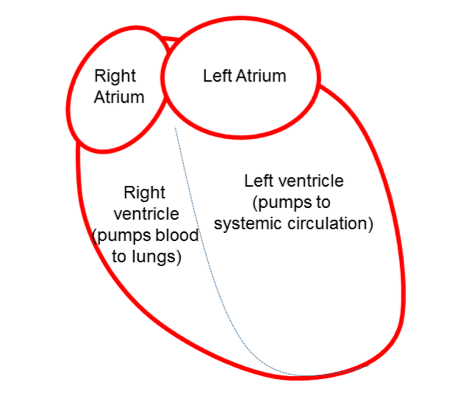
Synchronisation of the contraction of heart muscle is essential for the efficient pumping of blood through the circulatory system. Cardiac contraction is controlled by the regulated spread of electrical impulses from cell-to-cell within the heart. In pathological conditions, these electrical impulses can become disordered and lead to abnormal heart rhythms, known as arrhythmia. Arrhythmia can impair cardiac output (the volume of blood pumped per minute), leading to episodes of syncope (loss of consciousness due to a fall in blood pressure) and death. It is estimated that 5-10% of all deaths in the developed world are due to sudden cardiac arrest, primarily because of lethal arrhythmia of the lower chambers, or ventricles, of the heart (Figure 1).
Cardiac optical mapping is a fluorescent-imaging technique used in the study of the electrical properties of multicellular cardiac preparations (including the study of arrhythmia). Applications range from imaging of monolayers of pluripotent stem-cell derived or neonatal cardiac myocytes to intact tissue preparations, including, muscle slices and isolated hearts. Optical mapping involves the use of voltage-sensitive dyes that track changes in the potential difference across the cell membrane of the cardiac myocytes and can be used in conjunction with fluorescent-microscopy to image the spread of electrical waves throughout the heart. Optical mapping is a popular experimental technique due to its potential to generate high spatiotemporal resolution information on electrophysiological properties and has been used to interrogate the fundamental mechanisms governing the electrical stability of the heart in health and disease.
The purpose of the present article is to provide an overview of the theory and technical implementation of optical mapping.
Basic Theory of Potentiometric Dyes
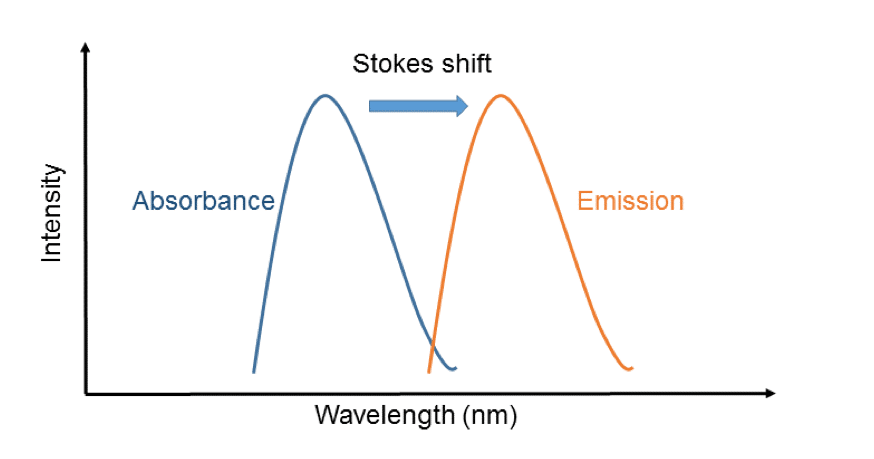
Fluorescence is the process whereby a molecule absorbs photons of light of a particular wavelength (absorption) and emits light of a longer wavelength (emission). This is underpinned by the phenomenon of the Stokes shift (Figure 2), whereby a photon excites a molecule to a higher-energy state.1 After a short time, a photon is re-emitted, but, due to energy loss to other processes, it has less energy and therefore a longer wavelength. The resulting spectral separation between the absorbed and emitted light allows fluorescent molecules to be used as labels in microscopy, where the sample is illuminated with light at the excitation maxima of the dye and emitted light is then collected through a series of optical filters (that exclude excitation light) and is projected onto a digital camera.
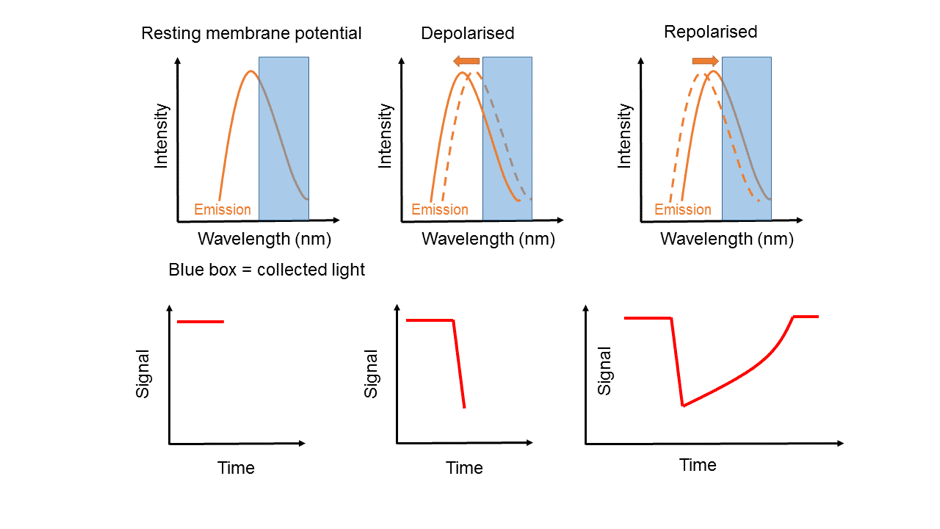
Voltage-sensitive (potentiometric) fluorescent dyes are a type of fluorescent dye that respond to changes in the voltage across the cell membrane.2 Potentiometric dyes insert and orientate across the cell membrane respond to changes in membrane potential by a shift in the spectrum of emitted light. By use of optical filters to define a band of interest within the emission spectrum of the potentiometric dye, the magnitude of recorded fluorescent light will vary with membrane potential. During the cardiac cycle, myocyte membrane potential depolarises (i.e. becomes more positive) which leads to a decrease in fluorescence, and then slowly repolarises back to the resting level, with a concomitant increase in fluorescence (Figure 3). Thus, voltage-sensitive dyes, as used in optical mapping, generate a signal that is inversely proportional to the membrane potential (producing an inverted cardiac action potential).
Commonly used potentiometric dyes in cardiac optical mapping are those of the fast responding styryl dyes, which include Rh-237, Di-4-ANEPPS, and Di-8-ANEPPS. Each dye has its own specific spectral properties that should be considered when configuring an optical mapping set-up. In practice, for Rh-327, excitation light should be in the region of 525±10nm and emitted light >710nm should be collected.
Basic Equipment and Reagents
Equipment
Perhaps the most important hardware in relation to optical mapping is an appropriately sensitive camera that can collect data at a temporal resolution of at least 300Hz (>500Hz would be preferred) and usually with a pixel diameter of several hundred micrometres or less. Spatial resolution is rather dependent upon the application in mind (e.g. size of tissue under study), but reduced pixel diameter provides more detailed information, though at the expense of an increased signal–to-noise ratio. There is an inherent trade-off between sensitivity, spatial, and temporal resolution, and care should be taken in selecting a camera that is up to the task. Most modern cameras have facilities such as pixel binning or region of interest selection, which can be used to improve speed at the expense of spatial resolution. Cameras with photodiode, charge-coupled device (CCD), and complementary metal-oxide-semiconductor (CMOS) arrays have been used in optical mapping. Classically, photodiode arrays provided the best speed and sensitivity, but with lower spatial resolution compared with CCD and CMOS based-cameras. However, due to continued advances in camera technology, CCD and CMOS cameras now provide the best temporal and spatial resolution. Moreover, modern electron multiplying CCD cameras are extremely sensitive and so are ideal for low-light applications. Because of the evolving landscape, it is recommended that advice is sought from camera manufacturers in relation to suitable cameras for application cardiac optical mapping.
Beyond a camera, a suitable system is required for collecting emitted light and projecting the image onto the camera sensor. This can range from a fully-fledged microscope, which has flexibility in terms of scale, to simple fixed-magnification set-up. The main components of a simple system are a lens, which sets the focal length and magnification factor, and a high-quality optical filter. Filters may be band-pass or long-pass in design, depending on the dye of interest (for example, a long-pass filter that transmits light >710nm can be used for rh-237). To allow for focusing, the system should have the ability to alter the distance between the sample and the lens. The camera can be mounted at the far end of an appropriate length tube, with the optical filter placed within the light path.
A system for illumination of the sample is also required. Light-emitting diodes (LEDs) are favoured, as they can generate high-levels of light with a specific waveband. A suitable power source, preferably with feedback controls to prevent oscillation in light intensity, is required and a band-pass optical filter can be placed in front of the LED to exclude light outside the excitation wavelengths of interest.
Finally, data need to be digitised and stored on a personal computer of suitable capacity. Optical mapping files can easily be several gigabytes in size, so higher-end systems with fast processers and large amounts of random access memory would be a preferred choice. There are many commercial solutions for the collection and storage of data, but Micro Manager (https://micro-manager.org/) is an open-source solution that supports many common cameras. Data are stored as stacked image files, which can be processed at a later date.
Additional equipment will be required for the maintenance of tissue viability, such as a heated perfusion system for isolated perfused hearts, but this will depend upon the specific application in mind.
Reagents
Beyond the basic reagents required for the maintenance of viability of the preparation of interest, optical mapping requires a potentiometric dye and, in the case of intact tissues, an uncoupling agent. Uncoupling agents are necessary due to the motion artefact caused by cardiac contraction, which distorts optical recordings. In theory, uncoupling agents abolish contraction whilst maintaining the normal electrical activity of the heart. In reality, most uncoupling agents have been shown to have some impact on the electrophysiological properties of the heart. However, blebbistatin has emerged as the uncoupling agent of choice due to its apparent lack of adverse effects.3 Blebbistatin is usually used at concentrations in the range of 10-20mmol/L. The potential impact and limitations of uncoupling agents should be kept in mind when interpreting the results of optical mapping data. Uncoupling agents may not be necessary for experiments in cell monolayers.
A Typical Experiment
Optical mapping can be applied to a broad range of preparations and so there is no single way to perform an experiment, however, a basic experimental protocol would have the following steps:
- Isolate tissues
- Infuse/perfuse the uncoupling agent
- Once contraction has abated, stain with dye
- Illuminate with LEDs and focus camera
- Record data
Specific details on the concentration of reagents and correct procedures for staining can be found within the appropriate scientific literature.4 Care should be taken to limit light exposure times and light intensity, as this may have toxic effects on the tissues under study. A pragmatic approach is required and trial and error when setting up a new system is to be expected. Pilot studies will be necessary to characterise and optimise each new system. Typically, staining may last from 20-40 minutes, but multiple dye loadings can be performed in a single preparation if the signal quality declines over time. Care should be taken with Di-4-ANEPPS (and possibly Di-8-ANEPPS), as this dye has been suggested to affect the speed of electrical propagation in the heart.5
Data Processing and Analysis
Data from optical mapping experiments require extensive processing before analysis. Limited commercial software solutions are available to achieve this, but with a small investment of time, it is not overly difficult to produce customised software for this application. For example, built-in functions within MatLab can be used to import stacked images, perform spatial and temporal filtering, and to measure common electrophysiological parameters. A helpful online community of MatLab enthusiasts and well populated public forums can support such an endeavour.
Raw optical mapping data is noisy and signals from individual pixels often have a poor signal-to-noise ratio. This is in part due to the relatively small change in fluorescence with potentiometric dyes (~5-10%), but also because of the introduction of non-biological noise by various means (e.g. thermal noise in the camera). However, signal quality can be significantly improved significantly by the application of appropriate filtering techniques.6 The first step is to define the region of interest and to exclude background pixels from the subsequent spatial filtering. From there, spatial filtering involves the averaging of data from adjacent pixels (typically in a 3×3 grid), which is applied in a pixel by pixel manner and acts to smooth out high-frequency non-biological noise and thus significantly increases the signal-to-noise ratio. Spatial filtering techniques like Gaussian filtering, which place greater weight on data from the central pixel within the grid of interest, are preferable. Temporal filtering, which smooths data within a pixel in the time domain, can also be used. There are many types of temporal filter, but a common approach is that of the Savitksy-Golay filter, which smooths the underlying data according to a moving, low-degree polynomial and is designed to increase the signal-to-noise ratio without greatly distorting the signal. However, it is important to note that over filtering in both the spatial and temporal domain impacts on data, slurring local activation/repolarisation times and action potential morphology, respectively. Thus, filtering should be limited to the minimum required to achieve adequate signal quality, without impacting on the results of the study. Moreover, the same filters should be applied to all data within a single study. Temporal alignment and averaging of sequential beats is another approach that can be used to improve signal quality in situations where data from a single beat is not required. From filtered data, it is possible to calculate many common electrophysiological parameters, such as, local activation times, conduction velocity and action potential duration. Common approaches to these measures can be found within the scientific literature. Resulting data can then be presented as spatial distribution maps and quantified for group comparisons.
Conclusion
Cardiac optical mapping is a powerful technology for high spatiotemporal resolution study of electrical behaviour of the heart. With advances in camera technologies and decreasing costs, optical mapping is fast becoming a mainstream technique in cardiovascular research.
References
- https://bitesizebio.com/19629/fluorescence-101-a-beginners-guide-to-excitationemission-stokes-shift-jablonski-and-more/
- Efimov et al. Circ Res 2004;94:21-33
- Federov et al. Heart Rhythm 2007;4:619-626
- Winter et al. Front Physiol https://doi.org/10.3389/fphys.2018.00016
- Laughner et al. Am J Physiol Heart Circ Physiol 2012; 303:H753-H765
Written in conjunction with James Winter, Ph.D.


 7")


