
The ‘diffraction limit’ of a microscope is the minimum distance between two fluorophores where they can still be discriminated as two separate objects. This diffraction limit has long constrained attempts by biologists to observe the intracellular environment. With a lower limit of ~200nm in confocal microscopy, this diffraction limit significantly limited the detail you could obtain when imaging cellular structures, protein interactions, and dynamics. But not anymore!
This lower limit was shattered with the recent advent of some new techniques. In this article, I will outline their pros and cons, their importance, and give some examples of how they are being used.
Total Internal Reflection Fluorescence (TIRF) microscopy
Before I talk about super-resolution microscopy techniques, I would be remiss not to mention TIRF. TIRF microscopy (also known as evanescent wave microscopy) is based on classical widefield microscopy, where fluorophores near the coverslip (and therefore near the cell surface) are selectively excited whilst fluorescence further away from the coverslip is minimized.
The technical stuff
TIRF microscopy is achieved by taking advantage of the so-called critical angle of light, resulting in the light being totally reflected at the coverslip-sample interface. This results in the creation of an evanescent wave (a near-field wave which decays exponentially) that can only penetrate ~100nm into the sample. Because only fluorophores within this wave are excited, there is less background fluorescence, which makes TIRF sectioning depth superior to confocal microscopy
Choose a free resource to help you move forward
EBOOK
Guide to Special Stains for Histology
POSTER
Fluorescent Proteins Guide
How does this help you?
TIRF microscopy works with both fixed and live cell samples. It can help you image membrane-proximal events at an improved resolution, whilst removing interference from fluorescence within the cell. In this way, it can be used to image the cytoskeleton, membrane-bound proteins, and intracellular molecules that are close to the plasma membrane.
Examples of how it’s been used:
- Microtubules are responsible for Golgi vesicle transportation (Schmoranzer and Simon, 2003)
- Imaging dynamics of signaling molecules at the T cell immune synapse (Purbhoo et al, 2010)
Super-resolution imaging techniques
Now let us enter the realms of ‘super-resolution’. These techniques can be, broadly speaking, grouped into two main classes:
- Class 1: Ensemble techniques – where the improvement in resolution comes from minimizing the size of the point spread function (PSF; the smallest representative of a single object that the system can form) during image acquisition. Two main ensemble techniques are Structured Illumination Microscopy (SIM) and Stimulated Emission Depletion (STED) microscopy, which have very different approaches to reducing the PSF during acquisition (and therefore improving resolution)
- Class 2: Single particle localization techniques – where resolution is improved by localizing single molecules.
Class 1: Ensemble techniques
Which technique is best for you depends on a combination of factors, including what you want to image and how you want to image it (live/fixed, etc). So first, let us take a look at Ensemble techniques. Later on in the article, I will cover single-particle localization techniques.
SIMS Microscopy
In June last year, Justin wrote a good explanation of how SIM works (including the maths!), but here is a brief overview to refresh your memory.
The technical stuff
In essence, SIM uses patterned lines of light that are changed and rotated to create a series of images with ‘high spatial frequency’ information. By imaging the sample with structured light patterns in different orientations, the images can be combined and reconstructed into a high-resolution image using computer algorithms
How does this help you?
- Theoretically, you can achieve a two-fold improvement in lateral resolution using this approach.
- SIM has become an attractive candidate for biological applications because standard dyes and staining protocols can be used, as long as the fluorophores used are stable enough to withstand multiple rounds of imaging.
Examples of how it has been used
- Microtubule polymerization and depolymerization dynamics in mitotic cells (Kner et al, 2010)
- The mesh of actin filaments at the Natural Killer cell immune synapse is remodeled to allow lytic granules to pass through (Brown et al, 2011)
STED Microscopy
STED microscopy, on the other hand, uses a different approach to reduce the PSF, by de-exciting fluorophores that have already been excited.
The technical stuff
In this technique, the sample is illuminated with a laser at a focal spot, in the same way as in confocal microscopy, but this focal spot is surrounded by a doughnut-shaped beam formed by a laser of a longer wavelength (called the STED beam). This depletes the fluorophores surrounding the focal spot back to the ground state, resulting in a smaller spot being detected.
How does this help you?
- A resolution of 30-80nm can theoretically be achieved using this technique (Hell and Wichmann 1994).
- The technique is not axially limited; cellular structures deep within the cell can be imaged. Live-cell STED imaging has also been reported.
It is important to note, however, that the choice of dye is crucial for STED microscopy, as the wavelength of the depletion laser should not overlap with the excitation range of the dye
Examples of how it had been used
- Distribution of proteins at neuronal synapses (Willig et al, 2006)
- Organization of SNARE proteins in the plasma membrane (Sieber et al 2006)
Class 2: Single Particle Localization Techniques
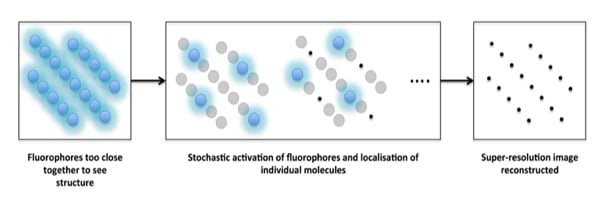
Single particle localization techniques work by pinpointing single molecules by reconstructing a super-resolution image from multiple frames (usually hundreds!). The concept behind the single-molecule localization techniques is that a single fluorophore, even though it is subject to the same diffraction limit as confocal microscopy, can be precisely localized by calculating the centroid (central point) of the PSF.
This is usually done by subjecting the resulting image to mathematical fitting, such as fitting to a Gaussian distribution, and then localizing the central point of each spot. We know that not all of you are confident in using mathematical fittings in your data, but that’s ok! It is enough to understand the basics. But if you want to know more about this idea, check out Thompson et al, 2002.
But how do we get this from theory to isolating each individual fluorophore from the blur that results from the large PSFs? This is where it gets clever! By keeping the activating laser beam at a low power, the fluorophores are excited ‘stochastically’, meaning that only a handful of all the fluorophores in a given image are excited in each frame.
These fluorophores are imaged until they are bleached, and the cycle is repeated as you collect more and more frames. By acquiring a large number of frames – and then localizing the center of the PSF for each particle detected in each frame – a full super-resolution image can be reconstructed (Figure 1).
So rather than altering the PSF, as in STED microscopy, single-molecule localization techniques achieve super-resolution by extensive post-acquisition image processing.
So, how is this done? The two main single-molecule localization techniques are PALM and STORM, which were invented around the same time. They are both based on the idea outlined above, but differ in the use of fluorophores.
PALM (Photoactivated localization microscopy)
The technical stuff
PALM uses photoswitchable and photoactivatable fluorescent proteins. In both of these cases, exposure to a specific wavelength causes the fluorophore to change its emission spectra – either from a non-fluorescent to fluorescent state (photoactivatable) or from one fluorescent state to another (photoswitchable). These photoswitchable and photoactivatable fluorescent proteins can be tagged onto your protein-of-interest in the same way as you would tag a protein with GFP.
How does this help you?
The potential for genetically encoded labeling is one of the main advantages of this method, as you do not have to worry about non-specific binding, and it is compatible with live cell imaging. The disadvantages are that you get lower photon counts with fluorescent proteins than with labeling with a dye, so it may be harder to obtain the full super-resolution image.
Examples of how it has been used
- PALM has been used to show the presence and reorganization of nanometre-sized clusters of NK cell receptors at the immune synapse (Pageon, et al 2013)
- Live cell PALM has been used to image the adaptor protein Lat at the T cell synapse (Williamson et al, 2011)
STORM (Stochastic optical reconstruction microscopy)
The technical stuff
STORM as primarily implemented using photoswitchable fluorescent dyes coupled to antibodies. This means that it is limited to fixed cell imaging. Direct STORM (dSTORM) is a variant of STORM based on the reversible photoswitching of conventional fluorophores into a long-lived ‘dark state’ (an energy level where the molecule cannot emit photons). This allows the STORM technique to use more conventional dyes such as AlexaFluor488 and 647, which makes experiment design and sample prep easier.
How does this help you?
The advantage of STORM over PALM is that you have control over antibody concentrations, and may be able to get a brighter stain and therefore better imaging processing. Also, using antibodies means you do not have to clone and transfect your protein-of-interest. This is a real plus if you need to image whole tissues – if you can avoid genetically engineered mice by all means, do. However, STORM is vulnerable to background in the form of non-specific antibody binding.
Examples of how it has been used
- STORM has been used to study the transport dynamics of cargo along microtubules (Balint et al, 2012)
- 3D STORM has been used to look at the three-dimensional filament organization of the actin cytoskeleton (Xu et al., 2012)
All of the super-resolution microscopy techniques that I covered in these last two articles have the potential to make big discoveries in the field of biology. So if you are lucky enough to have one (or two!) of these microscopes at your disposal, get to using them!
I hope this has given you a good (albeit basic) overview of how super-resolution microscopes work and what you can do with them. Keep your eyes open for my future articles on other super-resolution themes, including what to do with the all-important data once you have it!
References
Balint, S., Vilanova, I., Alvarez, A. and Lakadamyali, M. (2012) Correlative live-cell and Superresolution microscopy reveals cargo transport dynamics at microtubule intersections. PNAS 110:(9);3375–80.
Brown, A., Oddos, S., Dobbie, I., Alakoskela, J-M., Parton, R., Eissmann, P., Neil, M., Dunsby, C., French, P., Davis, I. and Davis, D. (2011) ‘Remodelling of cortical actin where lytic granules dock at natural killer cell immune synapses revealed by super-resolution microscopy.’ PLoS Biol.9 (9).
Hell, S. and Wichmann, J. (1994) ‘Breaking the diffraction resolution limit by stimulated emission: stimulated emission depletion fluorescence microscopy’. Optics letters 19 (11): 780-782
Kner, P., Chhun, B., Griffis, E., Winoto, L. and Gustafsson, M. (2009) ‘Super-resolution video microscopy of live cells by structured illumination.’ Nature Methods 6 (5): 339-342
Pageon, S., Cordoba, S., Owen, D., Rothery, S., Oszmiana, A. and Davis, D. (2013) Superresolution microscopy reveals nanometer-scale reorganisation of inhibitory natural killer cell receptors upon activation of NK cell. Science Signalling, 6:(285);ra62.
Purbhoo, M., Liu, H., Oddos, S., Owen, D., Neil, M., Pageon, S., French, P., Rudd, C. and Davis, D. (2010) ‘Dynamics of subsynaptic vesicles and surface microclusters and the immunological synapse.’ Sci. Signal. 3 (121).
Schmoranzer, J. and Simon, S. (2003) ‘Role of microtubules in fusion of post-golgi vesicles to the plasma membrane’. Mol Biol Cell 14 (4): 1558-1569
Sieber, J., Willig, K., Heintzmann, R., Hell, S. and Lang, T. (2006) ‘The SNARE motif is essential for the formation of syntaxin clusters in the plasma membrane.’ Biophysical journal 90L 2843-2851
Thompson, R., Larson, D. and Webb, W. (2002) Precise nanometer localisation analysis for individual fluorescent probes. Biophysical Journal 82:(5);2775–83.
Williamson, D., Owen, D., Rossym J., Magenau, A., Wehrmann, M., Gooding, J. and Gaus, K. (2011) Pre-existing clusters of the adaptor Lat do not participate in early T cell signalling events. Nature Immunology 12: 655–62.
Willig, K., Rizzioli, S., Westphal, V., Jahn, R. and Hell, S. (2006) ‘STED microscopy reveals that synaptotagmin remains clustered after synaptic vesicle exocytosis.’ Nature 440: 935-939
Xu, K., Babcock, H. and Zhuang, X. (2012) Dual-objective STORM reveals three-dimensional filament organisation in the actin cytoskeleton. Nature Methods, 9: 185–188.
You made it to the end—nice work! If you’re the kind of scientist who likes figuring things out without wasting half a day on trial and error, you’ll love our newsletter. Get 3 quick reads a week, packed with hard-won lab wisdom. Join FREE here.


