
Scanning electron microscopy (SEM) is a powerful technique, traditionally used for imaging the surface of cells, tissues and whole multicellular organisms (see An Introduction to Electron Microscopy for Biologists)(Fig. 1).

While the resultant images appear to be three dimensional (3D), they actually contain no depth information.
However, there are several SEM techniques that can obtain 3D information about a sample. Some of which can be done on any microscope and some that require specialist instrumentation, software, or microscopes in order to achieve that result. This article guides you through the available techniques.
Stereoscopy
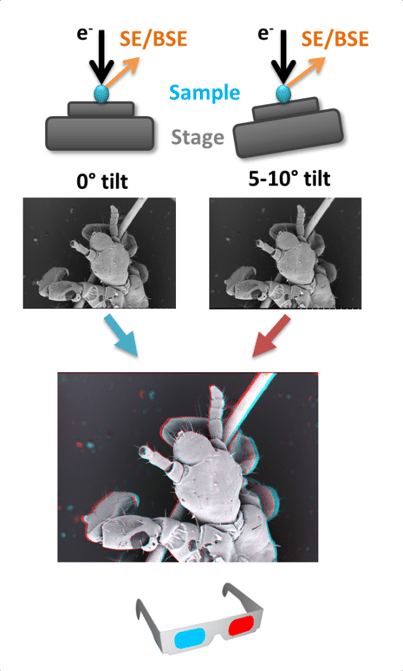
Stereoscopy is the process by which two slightly different images are presented to each eye, creating an illusion of depth in the image. The images can by coloured and combined to create a 3D anaglyph stereogram (Fig. 2) that can be viewed with anaglyph glasses. Stereograms are created by taking two images of the same area, tilting the specimen 5-10° between each image. The images are then tinted (red-green or cyan-maroon) and aligned. A digital model of the surface of a specimen can be created from stereoscopic images using specialist software, which allows z axis measurements to be made (Hughes et al., 2005). Vertical or overlapping details are often lost or distorted using this technique and data is restricted to the surface of the specimen, but this is a good method for obtaining topographical information. Stereoscopy can be used on any SEM with a tilting stage.
Photogrammetry
Photogrammetry is the process of capturing a series of overlapping images that can be used to reconstruct the object being imaged. The images usually cover 360° of the sample from several different angles (Fig. 3). This can be replicated using an SEM by turning and tilting the sample to image as much of the surface as possible. At least 50 images are required to construct a decent model and this can be time consuming in an SEM. This technique is possible on most SEMs using either a manual or an automated stage with a high tilt range. Photogrammetry produces a 3D representation of the surface of a sample but will not provide any information of interior structure.

Serial Section Array Tomography
Serial section array tomography (Micheva & Smith, 2007) is based on similar principals to serial section TEM but has the advantage that many thousands of sequential sections can be imaged. A diamond knife is used in an ultramicrotome to produce thin sections of a resin embedded sample. The sections are collected manually onto a substrate (e.g., a slide or coverslip) or onto a tape using an automated system, such as the ATUMtome. Once in the SEM, software is used to find and image the same area of interest on all of the sections (Fig. 4). Advantages with this method include the ability to image large volumes of tissue with EM resolution. It is also possible to use additional stains or antibodies on the sections for selective staining and it is possible to revisit the sample at a later date. The main disadvantages to array tomography are that there can be missing sections or artefacts such as wrinkles in the sections being imaged and there are limitations in the thickness of the sections, down to between 30 and 40nm thick with a good sample.

Serial block face scanning electron microscopy (SBFSEM)
SBFSEM (Denk & Horstmann, 2004) is also a serial section method. However, in this technique the diamond knife is located inside the SEM. The surface of a resin block, containing a specimen such as cells or a tissue, is imaged using backscattered electrons. The block is raised and the diamond knife removes a slice from the surface before another image is captured (Fig. 4). In this way, data can be captured across thousands of slices. There is no physical handling of sections; therefore section specific artefacts such as wrinkling and compression are eliminated. Alignment and registration of images is often easier than with array tomography. The minimum possible slice size is currently around 15nm, although between 30-100 nm is more common(Peddie & Collinson, 2014), which limits the z resolution that can be achieved in the data. The total volume that can be imaged is far less than with array tomography. This is due to a limit in specimen stage movement. For example, the Gatan 3view system has a maximum data volume of 600 x 600 x 600 µm before the sample has to be repositioned. SBFSEM is a destructive technique and it is not possible to revisit sections at a later date.
Focused Ion Beam Scanning Electron Microscopy (FIBSEM)
FIBSEM (Heymann, 2006) uses a beam of ions to ablate the specimen, creating a trench with a milled flat surface on one side. The electron beam is used to generate an image of the flat surface (Fig. 4). The ion beam is used to mill away a small layer of the surface and another image is captured. This is repeated thousands of times. FIBSEM is a destructive technique and sections cannot be revisited but multiple trenches can be made within the same sample. The field of view is typically smaller than with array tomography and SBFSEM due to limitations in milling time. However, the z axis resolution is far higher than with the other techniques mentioned. Slices of 3-5nm are possible, resulting in isotropic voxels in the final dataset (3D pixels that have the same dimension on all axes).
3D Data
Array tomography, SBFSEM and FIBSEM all produce 3D datasets of the interior and exterior of cells and tissues. Once images have been collected they are aligned and data is reconstructed into a 3D volume (Fig. 5). From this data, individual structures can be isolated (segmented) and qualitative and quantitative information obtained about the specimen. Data processing and analysis can be extremely time consuming (Peddie & Collinson, 2014, Borrett & Hughes, 2016) and requires computers with a lot of processing power but it is worth It for the detailed 3D information that can be obtained.

References
-
- Borrett, S. & Hughes, L. (2016) Reporting methods for processing and analysis of data from serial block face scanning electron microscopy. Journal of microscopy, 263:3–9.
- Denk, W. & Horstmann, H. (2004) Serial block-face scanning electron microscopy to reconstruct three-dimensional tissue nanostructure. PLoS biology, 2:e329.
- Heymann, J. A. H., M. Gestmann, I. Giannuzzi, L.A. Lich, B. Subramaniam, S (2006) Site-specific 3D imaging of cells andtissues with a dual beam microscope. . Journal of structural biology, 155:63–73.
- Hughes, L. C., Archer, C. W. & ap Gwynn, I. (2005) The ultrastructure of mouse articular cartilage: collagen orientation and implications for tissue functionality. A polarised light and scanning electron microscope study and review. European cells & materials, 9:68–84.
- Micheva, K. D. & Smith, S. J. (2007) Array tomography: a new tool for imaging the molecular architecture and ultrastructure of neural circuits. Neuron, 55:25–36.
- Peddie, C. J. & Collinson, L. M. (2014) Exploring the third dimension: volume electron microscopy comes of age. Micron, 61:9–19.
Further Resources