In many biological experiments the question that a researcher wants to ask is – ‘do some or all of my cells express a particular protein?’ There are many ways of doing this, which you will be familiar with e.g. Western blotting, immunoprecipitation, microscopic examination of stained cells and even mass spectrometry.
Using Flow Cytometry to Determine Protein Expression
Of course, this is the flow cytometry channel so it will come as no surprise to hear that flow cytometry is also an excellent way of doing this. In fact it has several advantages over microscopy (not relying on the eye to quantitate the level of fluorescence, the ability to multiplex protein detection) and western blots (quantitation and flow cytometry is a single-cell analytical technique, not a population one). On a flow cytometer we can detect up to 18 antigenic determinants on a single cell and look at thousands of cells per second, which helps with the problem of rare cells but does it help with the objectivity? Well, yes and no.
Flow cytometry is not absolutely quantitative, we will always have to have a control of some sort – we have discussed this in a recent article, so you know that providing the right control is critical. We can then compare this control with our specifically stained sample to determine if our sample is positive, but that is where the problems can begin… how do we define positivity?
Defining Positivity
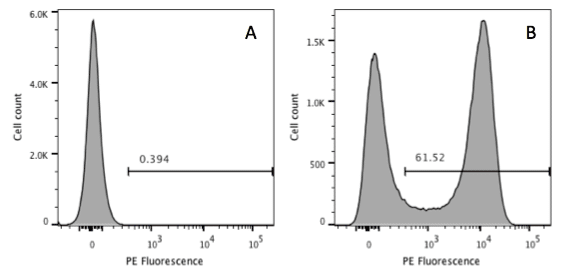
Figure 1. When there is an obvious positive and negative population it is easy to use a control (A) to set a marker to define positivity (B).
If you are lucky, you will have cells that are either obviously positive for your marker or they are negative (Figure 1). In this case it is relatively easy. We can set a marker on the control sample and everything that appears to the right in the test sample is deemed positive.

Figure 2. Negative sample (A) and test sample (B). Here there is no obvious positive population and an overlay (C) shows that probably all cells are weakly positive.
But what happens if the staining isn’t as bright, so that positives are not clearly visible? Then we need to again look at the pattern of staining. If we see two similar shaped peaks one shifted to the right (Figure 2), then one assumption could be that all cells are positive, just weakly so. In this case, instead of using a marker, we would look at a measure of fluorescence intensity such as the mean or more likely the median. However, this makes an assumption about the data that may not be true.

Figure 3. Negative sample (A) and test sample (B). The overlay (C) shows that some cells are negative and some are positive.
Let’s take another example, in Figure 3 we see a shoulder of ‘positivity’; this is likely to come about because there are some cells that are negative but there is a subset that are weakly positive and these two distributions overlap. So how do we deal with this?
Dealing with Weakly Positive Samples
A median fluorescence intensity probably isn’t the best way to do this as there is more than one population in the stained sample. So we go back to the first scenario and we use a marker. The way we would do this is take our control (negative, FMO, isotype) and set a marker such that a defined percentage falls to the right. In the early days of cytometry this was set to be about 0.1%. What you may not realise is that this isn’t an entirely arbitrary figure. A Gaussian distribution should have 99.7% of its data within three standard deviations of the mean, so by setting that marker at 0.1%, we are in effect setting the boundary of three SDs. In many situations this may not be the be the most appropriate place and some will use a 2% cut off (this represents about two SDs from the mean) as this will be less influenced by the odd stray event which may be important if you are sample limited. In either case the marker is kept in the same position when we run the positive sample. Then we can get a figure that gives us “percentage positive”.
It may not represent the true percentage positive but it is the best we can do with the data; to be more accurate we should probably say that ‘at least x% of the cells are positive’. It is possible to use deconvolution algorithms, which are used in many other areas of science such as microscopy, when we have to deal with overlapping distributions, but these are not commonly used in flow.
As with all flow data the key is to know which controls to use, use them correctly and consistently, and be consistent and logical with your data analysis and all will be well!