
Microscopy, by default, is a technique that allows us to observe, rather than measure, biological events and make conclusions based on what we see rather than on some calculations.
Sometimes, though, our observations must meet certain criteria to support our conclusions.
This article deals with measuring the condition crucial to so many protein research areas: protein colocalization.
Read on to discover two ways you can quantify and prove it.
Choose a free resource to help you move forward
POSTER
Histological Stains Poster
EBOOK
Guide to Special Stains for Histology
Why Is a Visual Determination of Colocalization Insufficient?
While there are situations where you can determine protein colocalization visually, a more accurate confirmation of a mutual distribution of two probes is usually necessary to draw incontrovertible conclusions.
Only when you collect images following a controlled protocol for colocalization analysis (with sufficient signal in each channel, no autofluorescence or signal bleed-through) is it safe to say that the two probes colocalize solely based on observation.
In such cases, if the red signal colocalizes with the yellow signal and the picture is mostly green, no statistical measurement is needed.
But, if you don’t see an overlap, it doesn’t mean it isn’t there! For a visual example of this, check out Figure 1 below.
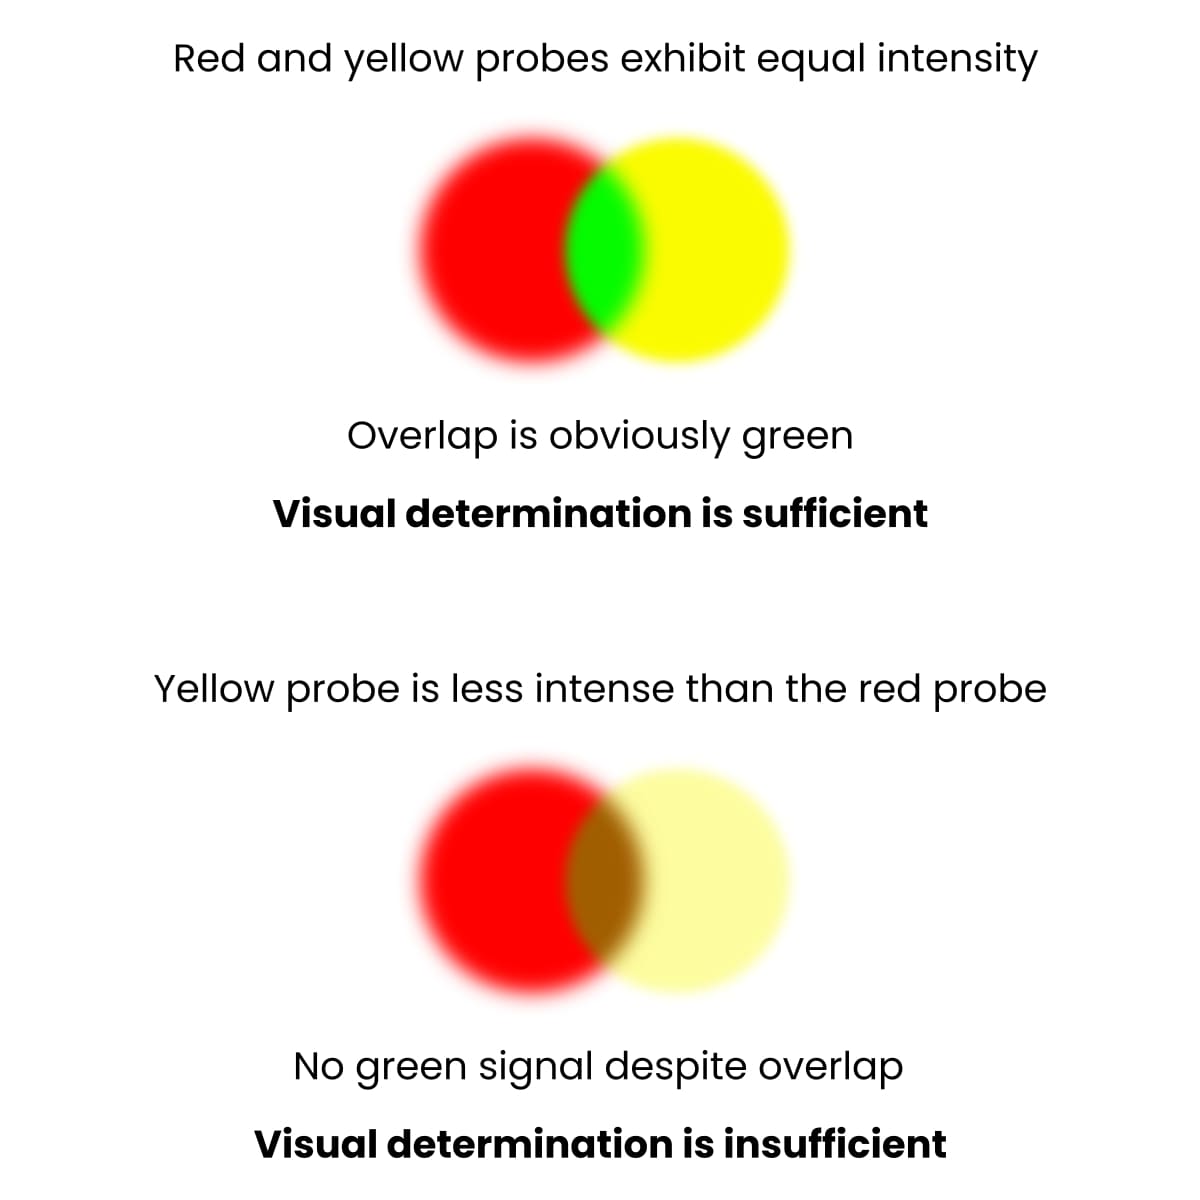
It can be that the intensities of the two channels are not the same. That’s to say, the intermediate color that we see can only appear if both probes have the same intensity.
That’s why conclusions based on visual determination often lead to false negative results.
What Methods for Overlap Measurement Exist?
While there is no one standard approach to this matter, there are two methods that are widely used and generally accepted:
- Pearson’s correlation coefficient (PCC).
- Manders’ colocalization coefficient (MCC).
These two methods relate to two different aspects of colocalization—correlation and co-occurrence. [1]
Pearson’s coefficient is related to the correlation of the pixel intensities in the two channels. It measures the relationship between signals. Specifically, if the signal values in one channel rise simultaneously with the other, or one signal falls when the other rises.
Correlation is distinct from co-occurrence, which is mathematically expressed through Manders’ coefficient. [2] This represents the coverage of one signal over the other, which reveals the extent to which two probes occupy the same place. Let’s explore this a bit further.
Two Methods to Prove Protein Colocalization
1. Pearson’s Correlation Coefficient (PCC)
Definition
PCC reflects the linear relationship between signal intensities.
The values can range between 1 (perfect positive correlation) and -1 (perfect negative correlation).
A value of 0 means that there is no correlation. It is possible to explore PCC visually through a scattergram where the coordinates on the plot represent pixel values (signal) in both channels. The more dots that cluster around a straight line, the better the correlation between the two signals
Requirements and Considerations
The PCC should be measured in the region of interest (ROI) to avoid false positives or negatives. If measuring PCC over the entire image, pixels of the background will correlate perfectly and inflate the PCC.
In contrast, if the measurement is performed in a region of no interest with a heterogeneous distribution of both channels, the PCC will be depressed.
You can select ROI by hand or by thresholding to exclude the background.
Whichever way you do it, be careful, especially when thresholding.
The selection of the ROI needs to include all the relevant regions of the cell(s). That’s every place where a probe can be expected to distribute.
If you use an intensity-based method for selecting ROI (thresholding), you might inadvertently exclude relevant results.
How can this happen?
You could have a region of mutual exclusion where neither label appears. This can be a biologically relevant result (both molecules are not expressed in that place in the cell). However, thresholding will not include this region in the ROI, putting you in danger of losing relevant results.
When is Pearson’s Correlation Coefficient Recommended?
PCC should be used on images where you expect a linear relationship between intensities.
If the data fits a more complex model, PCC will not perform well.
A different method should also be chosen if there is an uneven overlap, where probes co-distribute but in different proportions. This may occur when GFP is used as one probe. Its expression level may differ between cells and potentially cause depression of PCC due to high intercell variability.
2. Manders’ Colocalization Coefficient
Definition
MCC is a metric that describes co-occurrence—the fraction of one protein that colocalizes with the other.
MCC will give you a good measure of colocalization when you label one protein in a vesicle and want to see how it colocalizes with a specific structure in a cell, say a microtubule.
If we assume that all vesicles colocalize with microtubules, but only a proportion of microtubules colocalize with the vesicle, you can calculate MCC for each channel and get a metric that quantitatively describes this fractional overlap.
Requirements and Considerations
The catch with MCC is that it requires the elimination of background.
The trickiest part here is setting a cutoff point for the intensity that enables background subtraction.
MCC measures the complete fluorescence of one probe in every above-zero pixel. However, above zero pixels are extremely rare because of factors such as:
- Autofluorescence.
- Light leakage.
- Non-specific labeling.
- Fluorescence from out-of-focus image plains.
The measurement of MCC, therefore, requires a careful selection of the threshold (cutoff).
One way to do this is global thresholding, where you subtract a threshold value from each pixel so that every level below the selected cutoff will be background while every pixel above will fall into a region of interest.
While this is intuitive, global thresholding is crude and may lead to unwanted situations like excluding low-value pixels that are close to the background but are in fact positive and real data.
A more automatic and less subjective option is the so-called Costes method, where the threshold is estimated by calculating PCC multiple times.
This serves to define the range of pixel values that are positive and, therefore, should not be excluded. PCC is calculated for different groups of pixels, and the pixel values for which PCC is equal to or close to zero are taken as the threshold values.
Nevertheless, it should also be checked visually since in images with a lower signal-to-noise ratio, it may identify a threshold level so low it doesn’t distinguish labeled structures from the background.
When is Manders’ Colocalization Coefficient Recommended?
When the biological question of your experiment concerns the extent that proteins and cellular structures overlap, MCC should be the measure of choice.
These coefficients are more intuitively interpreted than PCC and are independent of signal proportionality (the differences in the number of structures labeled by each probe).
Be Objective and Control as Many Parameters as Possible
Whichever choice for measuring colocalization you opt for, it is very important that the image collection is performed in the correct way. And make sure your statistical analysis of your protein colocalization data is valid. [3]
Try to control as many factors as you can, and prepare a set of control samples that allow you to monitor as many variables as possible.
Keep in mind that visual colocalization determination is influenced by many factors, including:
- Observer subjectivity.
- Each individual’s brain processing colors differently.
- Possible color blindness of the observer.
- The spatial resolution determining the pixel size.
Among many others. So be sure to process the images you are about to analyze uniformly, and remember that any uncontrolled manipulation may cause you to lose relevant information.
Keep Your Software Up to Date
These calculations are implemented in most image analysis software packages, such as ImageJ and Volocity. But, given that measuring colocalization is still a somewhat confounding field, improvements are required, so keep track of the new versions and packages for the software.
Protein Colocalization Summarized
So there are two methods to quantify and prove protein colocalization.
The PCC method enables you to analyze colocalization data when it fits a linear model. And the MCC method enables you to analyze fractional co-occurrence data for more complex datasets.
Plus, we’ve covered factors to be aware of that reduce the objectivity of your observations.
Useful eh!
Is there anything in particular that you do when measuring protein colocalization? Let us know by writing in the comments section below!
Originally published May 2018. Revised and updated January 2023.
References
- Dunn KW, Kamocka MM, and McDonald JH (2011) A practical guide to evaluating colocalization in biological microscopy. Am J Physiol 300(4):C723–42
- Adler J and Parmryd I (2012) Colocalization Analysis in fluorescence microscopy. In: Cell Imaging Techniques: Methods and Protocols, 2nd edition. Humana Tototwa: New Jersey
- Mcdonald JH and Dunn KW (2013) Statistical tests for measures of colocalization in biological microscopy. Journal of microscopy 252(3):295–302
You made it to the end—nice work! If you’re the kind of scientist who likes figuring things out without wasting half a day on trial and error, you’ll love our newsletter. Get 3 quick reads a week, packed with hard-won lab wisdom. Join FREE here.


