
 Problems with expressing your gene? One of the potential stumbling blocks in heterologous gene expression is incompatible codon usage. Every amino acid can be encoded by more than one codon, and for every amino acid each organism has a favorite codon that it tends to use more often than the others. The availability of tRNA in the organism will reflect this codon usage bias.
When expressing a foreign gene from a given organism in an expression host, the codon usage of the source organism and the expression host may be very different. If the foreign gene has stretches of codons that are rare in the expression host, the expression host will effectively run out of tRNA for the rare codons, preventing or reducing expression of the protein.
geneart.de’s browser-based codon usage analysis tool* can compare the codon usage compatibility of your particular gene/expression host combination and give an indication of whether this is likely to be a problem.
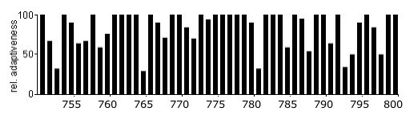
In the following example, I have examined the compatibility of a R. norvegicus cytoskeletal protein with the E.coli expression host. The following graph shows the codon usage for a selected portion of the R.norvegicus gene, when expressed in the native organism. Each bar represents an individual codon, and the high percentages indicate that each codon has a high frequency of usage.
Choose a free resource to help you move forward
EBOOK
Free Guide to Protein Expression
CHEAT SHEET
Western Blot Cheat Sheet
The next graph shows the same section of the gene, but compared with the E.coli codon bias. Note the stretches that have low or very low codon usage frequency – these could mean that the gene will be problematic to express in E.coli.
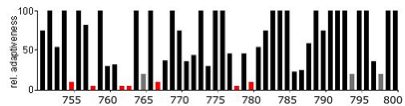
Although codon usage is not the only barrier to success in heterologous gene expression, this tool provides a very easy way to check the compatibility of your gene and expression system before you start.
*Since this article was first published on August 31 2007, this tool is no longer available. But luckily there are lots of alternative tools for you to try such as the Graphical Codon Usage Analyser (GCUA). We dusted off this article, updated it and republished it on 5 March 2015.
You made it to the end—nice work! If you’re the kind of scientist who likes figuring things out without wasting half a day on trial and error, you’ll love our newsletter. Get 3 quick reads a week, packed with hard-won lab wisdom. Join FREE here.


