Are you wondering how on earth you’re going to count thousands of cells across a stack of images?
Well, this article shows you a simple method for automatic cell counting with ImageJ. Perfect for your cell proliferation studies, gene expression analysis, or whatever your downstream application might be.
What is ImageJ?
For those unfamiliar with ImageJ, it’s a popular open-source image-processing program that runs on Mac, Windows, and Linux.
It has loads of uses in biology research, including:
- Automatically counting cells in microscopic images.
- Differentiating between various cell types based on size, shape, or color.
- Quantifying fluorescence intensity in cells or tissues.
- Measuring cell and tissue dimensions such as area, perimeter, and length.
- Identifying and quantifying particles like vesicles, beads, or organelles.
- Quantifying stained areas in histological sections.
- Enhancing image quality through noise reduction, contrast adjustment, and sharpening (just be sure to let people know when you’ve done this).
Assuming you have ImageJ downloaded, let’s begin with a single image of fluorescent cells waiting to be counted.
1. Setup for Automatic Cell Counting
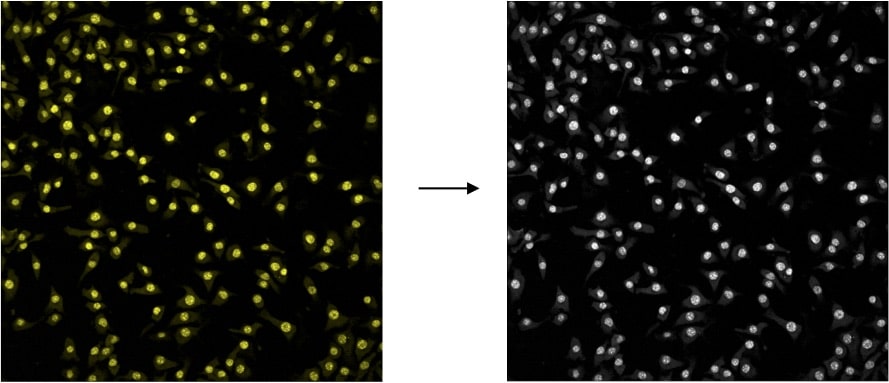
First, load your image by dragging it into the ImageJ toolbox. If you aren’t using colored images, that’s not a problem.
As long as you can identify the cells against the background, you’re in good shape. We need to convert to grayscale in the first step either way.
To do this, select Image > Type > 16-bit Grayscale.
2. Adjust the Threshold
To distinguish cells from the background, use the threshold feature.
You use this feature to suppress certain pixels in the background by removing intensities below/above a certain threshold.
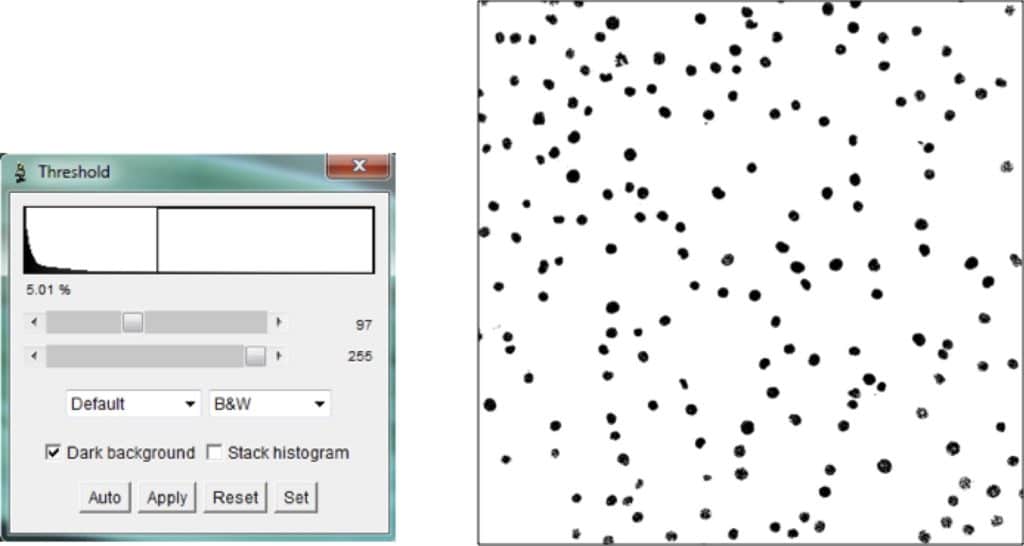
To adjust the threshold, select: Image > Adjust > Threshold.
The first slider determines the lower bound, while the second slider determines the upper bound.
The goal is to suppress lower-intensity pixels that do not make up cells; therefore set the second slider at 255 and focus on adjusting the lower bound. Each image is different; therefore, you’ll need to play around with the slider to remove as much background as possible without removing cells.
For example, I could remove pixels with an intensity value below (say) 97 to give me a binary image in which cell pixels are black while everything else is white.
3. Identify Cells
Now that we’ve identified which pixels make up cells, we’re going to cluster pixels based on circularity using the analyze particles feature.
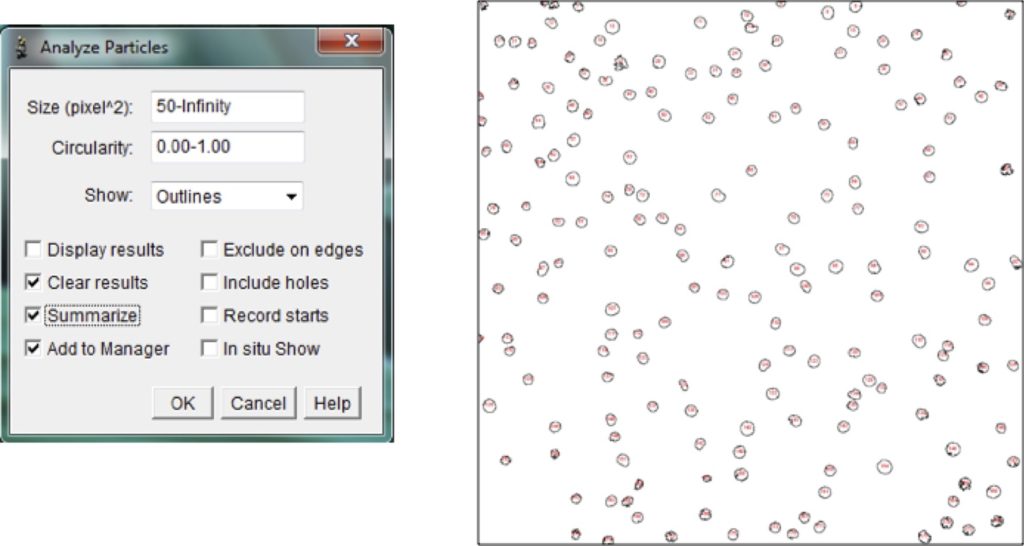
To analyze particles, select: Analyze > Analyze Particles.
The first parameter to consider is size.
Basically, you’re telling the program to ignore any clusters it identifies that are too small to be a cell. Putting a lower bound in place is important to ignore circular substructures within cells.
One way to find a good number is to draw a circle representative of the smallest cell in your image. You can then press the key m and a measurement box will pop up, providing the area (pixels^2).
Set this value as your lower bound. Usually, you can leave the upper bound as infinity unless multiple cells are packed together. However, if this is the case, set the maximum cell size using the described method. The second parameter is circularity, which asks how circular your cells are. I’d recommend retaining the default setting.
4. Automatic Cell Counting
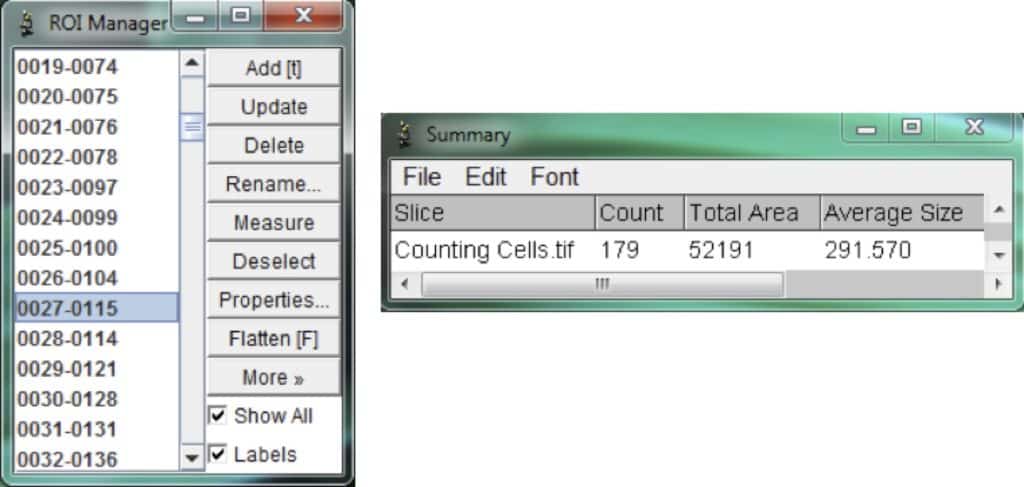
After clicking OK in the analyze particles box, the ROI manager and a summary will automatically appear. The ROI manager contains all the cells (or regions of interest) that were selected.
If necessary, select cells and make manual adjustments if non-cell clusters were selected. The summary box provides you with the total number of cells along with other useful measurements.
To alter the summary measurements, before you analyze the particles in the previous step, select: Analyze > Set Measurements.
That’s It
We’re done. Happy counting!
If you’re looking for more ways to automate data processing in the lab, don’t be afraid to search online.
ImageJ is a powerful tool and there are hundreds of tutorials even for more advanced workflows. Also, check out my article on measuring intracellular fluorescence with ImageJ.
Editor’s note: I am not the original author of this post. This post has an anonymous author but requires authorship details to exist on bitesizebio.com.
Originally published October 2016. Reviewed and updated June 2024.


