
What is one of the first steps of the flow cytometer start-up routine? To check if the cytometer is in good shape, of course! Everyone wants to run on a reliable instrument, and assessing the daily performance of the instrument show us its behaviour over time and allows us to react fast in case of disturbance. It is also a useful step to standardise the results between experiments during longitudinal studies, as well as improve reproducibility.
How Do We Assess the Performance?
Bead-based systems are the gold standard for to assessing the overall “well-being” of a cytometers because they have defined fluorescence and give reproducible results in the long run. One of the more common bead-based systems was developed by BD (Becton Dickinson) in the mid-2000: the Cytometer Setup & Tracking (CS&T) beads. They are polystyrene beads dyed with a mix of fluorochromes that will emit fluorescence in all channels at different intensities (bright, mid, and dim). When paired with the CS&T software (within FACSDiva), this combination allows easy daily cytometer check-up. Of course, other standardised beads can be used on the instruments without CS&T software, including rainbow beads, 8-Peak Beads, etc. In that case, the performance of the cytometer is checked manually. Published protocols are available for help (see the references below the article).
In the case of CS&T beads, one drop of beads is mixed with diluent before running them on the machine. Now, you can watch the events jumping around while worrying something is wrong. But, fear not, the flow cytometer is just identifying the beads! For each channel, it will then record different parameters that will be compared to reference values (aka the baseline). The performance will pass if the daily values fall in the recommended range. If these values exceed the range but are still in a tolerable span, there will be warnings. The performance control will fail if the values are over the tolerated range. Since the CS&T report is automatically saved, you can track the performance of your cytometer over time.
Example of Report: the Main Features of the CS&T Performance Report
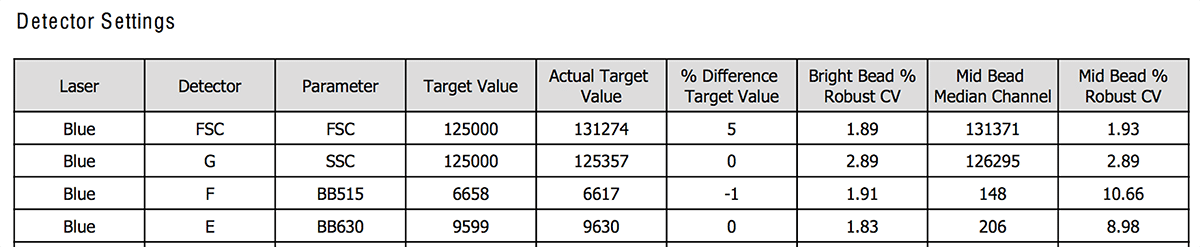
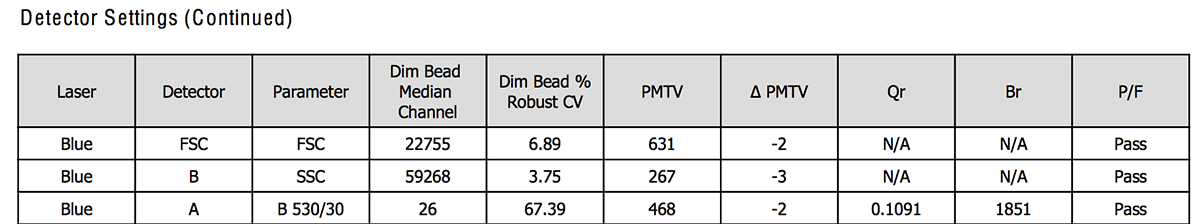
Figure 1 and 2 shows an example of how the CS&T report looks like for the detector settings section of the blue laser only. For all the channels of the blue lasers, the report will display the value recorded from the beads that day (like the actual target value) or the calculation it has done (ΔPMTV for instance).
Choose a free resource to help you move forward
DOWNLOAD
Blood Collection Tube Chart
CHECKLIST
Checklist For Writing a Scientific Review
What Are Those Parameters Recorded? Below, You Can Find the Main One:
- PMTV: it is the PMT voltage, calculated by the CS&T algorithm (Fig. 2). It is adjusted from the baseline PMT voltage to reach the same MFI. It is a way to keep a stable MFI over time even if the instrument has some minor issues. If the correction (=ΔPMTV) exceeds 50V, the performance will fail.
- Actual target value: MFI of the beads that day (Fig. 1).
- %rCV: it is the robust coefficient of variation (Fig. 1 and 2). It is an alternative approach to calculate the CV that is less sensitive to outliers than the CV. The rCV should be ideally around 3. For more information on the CV, check the previous BitesizeBio article.
- Optical Background (Br): noise collected from the optical path (Fig. 2). The more background noise there is, the higher Br is. Thus, a low Br will give high resolution.
- Detector efficiency (Qr): it is the number of photoelectron detected per fluorescent molecules (Fig. 2). The higher Qr, the higher the resolution.
- Laser delay: since the lasers are physically separated, the beads will intercept the lasers at different time. The processed data from the first laser are delayed until the beads reach the last laser. Thus, the data from a single event will be processed together. These delays are specific for a certain sheath pressure.
Troubleshooting: What to Do If the CS&T Performance Failed
Sometimes, the CS&T performance of your flow cytometer will fail, indicating that your cytometer needs some special attention. This task is often taking care by the facility manager but there are some tips you can try before calling them for help.
The first reflex is to prepare new beads. The beads may be too old, too dilute, or may have been photobleached. Don’t forget to mix the beads well before using them and always run the beads at low speed; you want to ensure that each bead goes through the tube separately.
The second thing to check is the sheath filter and the tubing for the presence of air bubbles. If necessary, you can purge the system as per your instrument guidelines.
Below, you can find the most common causes of failures and what to do. It is not an exhaustive list, and there are plenty of other possible causes of CS&T performance failure.
Issues | Possible causes | What to do |
No event |
| - Unclog your flow cytometer. Check the previous BiteSize Bio
- Check the tubing for trapped air - Check the intermediate sheath and waste tank for leakage - Check that the sheath fluid tank is full and that the waste tank is empty - Check if the bal seal (it’s the o-ring shaped object that seal the tube when you put the tube on the machine) is worn (if worn, the tube will fall when the arm is open) - Check the sample tube for cracks – even a small crack can prevent acquisition of sample |
%rCV failing | Micro-bubbles in the flow cell | - Clean with 5 min clean solution and 5 min of water can help but long monthly clean is better - Prime - Lasers need more than >30 minutes to be ready - Align the lasers - Engineer might be needed |
PMTV failing | Micro-bubbles in the flow cell | - Clean with 5min clean solution and 5 min of water can help but long monthly clean is better - Prime - Check if the short pass filter is in the right position: the numbers should face inwards - Align the lasers - Engineer might be needed |
All the values of one laser are off | The laser is off The laser is broken | - Turn on the laser - Engineer needed |
Some of these issues need qualified personnel to solve them. After trying some of this few tips, if the performance still failed, call your facility manager for help!
References:
Using the BDTM Cytometer Setup and Tracking (CS&T) for instrument characterization and Performance Tracking, Mark KuKuruga, Senior Technical applications Specialist, BD Biosciences
BDTM CS&T beads user guide, 04/2015
BD Cytometer Setup and Tracking Application guide for BD FACS Digital Flow Cytometer, June 2007
Cossarizza A et al. (2019) Guidelines for the use of flow cytometry and cell sorting in immunological studies (second edition). European Journal of Immunology 49: 1457-1973.
Perfetto SP et al. (2012) Quality assurance for polychromatic flow cytometry using a suite of calibration beads. Nature Protocols 1, 1522-1530.
Wood JCS and Hoffman RA. (1998) Evaluating sensitivity on flow cytometers: an overview. Cytometry 33:256-259.
You made it to the end—nice work! If you’re the kind of scientist who likes figuring things out without wasting half a day on trial and error, you’ll love our newsletter. Get 3 quick reads a week, packed with hard-won lab wisdom. Join FREE here.


