After designing a multicolor flow cytometry panel and securing the necessary cells and reagents, the process of optimization of the panel can begin. The first step in that optimization is titration of your antibodies.
In this process, following a standard protocol to be used in the final analysis, you stain a known amount of cells with decreasing concentrations of antibodies. You can then analyze the results to determine the best signal-to-noise ratio using standard calculations. Below I provide an overview of how to properly titrate your antibodies.
Why do we titrate?
To be able to make accurate measurements of fluorescence, it is important to maximize the signal while reducing the noise. Some noise is unavoidable which comes from the cells (autofluorescence), and the inherent noise in the system. Titration helps minimize noise due to non-specific binding of the antibodies to low-affinity targets.
Low-affinity targets?
Antibodies will preferentially bind to the high-affinity epitope they are raised to target (your target of interest). However, if there is an excessive amount of antibody around, and the primary targets are occupied, the antibody will bind to low-affinity targets (off-target effects). This is especially true in the case of intracellular targets, but can also occur on the surface of cells.
Put this article into practice
Choose a free resource to help you move forward

DOWNLOAD
Blood Collection Tube Chart

EBOOK
Guide to Lab Safety
Thus, titration attempts to find the concentration of antibody that gives the brightest signal with the lowest background.
Why not use vendor-recommended concentrations?
Often vendors sell reagents in “100 test” concentrations, or give a recommended concentration based on their standard tests. Since the conditions in the assay in the lab are probably very different, spending a little time to do this optimization based on the cells of interest, and under the specific assay conditions that will be involved is worth it to get the best results.
Behold the process and data
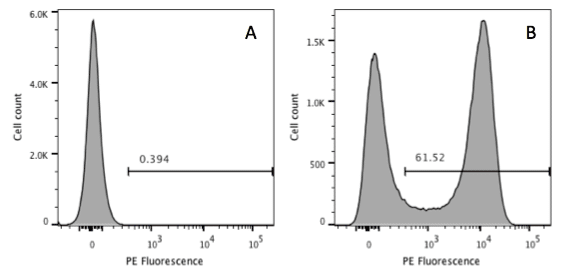
Here I give you an example of a titration optimization experiment. In this instance one million cells were stained with decreasing concentration of antibody. After acquiring the cells on the flow cytometer, single cells of interest were gated and the positive and negative populations were identified, as shown in Figure 1.

The specific statistics extracted were then used to calculate the staining index (SI) (Telford et al. 2009) (Figure 2). This equation uses the difference between the median fluorescent intensity (MFI) of the positive signal (Medpos) and the MFI of the negative signal (Medneg), and divides that difference by the right side of the negative curve (84%neg-Medneg). This SI calculation is a modification of the one originally discussed by Maecker and others (Maecker et al., 2004, Bigos 2007) .

Finally, the titration curve was plotted and optimal dilution determined (Figure 3).

As seen in this titration curve, the optimal concentration is identified based on the points where the SI is highest and slight changes (due to experimental error) do not cause the SI to decrease. Above the best range (orange), the SI decreases because of an increase in the background. Below the optimal range the SI decreases because of a decrease in the staining of the positive cells.
The identified concentration is approximately 1/2 of the vendor’s recommended concentration – so titration in this instance will save you money on reagents while improving the staining of your cells of interest.
Titration can be performed in the presence of viability dyes (recommended) (include link to viability die article), and reagents needed to identify the cells of interest. Optimize those first before performing the titration on your specific reagent. Remember to titrate the reagent in the same conditions as the assay it will be used in.
Parting Comments
It is important to remember that if you change cell types or the assay conditions, you should re-titrate your antibody. Assay conditions, in particular, can cause significant changes to the titration. Why risk your critical experiment by not re-titrating the antibody?
A second question I am asked is in regards to how to scale up from the titration reaction. There are four things that influence the titration – concentration of Ab, time of incubation, temperature of incubation, and number of cells. Of these, number of cells is the least critical. Concentration is critical. If you stain 106 cells in 50 ml one day and stain in 100 ml the next, you will need to double the Ab concentration on day two. On the other hand, if you stain 106 cells one day and 5 x 10⁶ cells the next day – all in the same volume, you will not have to change the antibody concentration. In fact, when I stain 108 cells for a cell sorting experiment, I will still stain in 50 ml, and increase the antibody about 3–5 times (not 100 times).
Take a day and titrate your reagents – the lab budget will appreciate it, the data will be improved and you will be will on your way to optimizing your experimental panel. Next step will be optimizing the voltage for measuring each fluorochome.
References
Telford W.G., Babin S.A., Khorev S.V., Rowe S.H. (2009) Green fiber lasers: An alternative to traditional DPSS green lasers for flow cytometry. Cytometry 75A: 1031–9.
Maecker H.T., Frey T., Nomura L.E., Trotter J. (2004) Selecting fluorochrome conjugates for maximum sensitivity. Cytometry 62A: 169–173.
Bigo M (2007) UNIT 1.21 Separation Index: An Easy-to-Use Metric for Evaluation of Different Configurations on the Same Flow Cytometer. Current Protocols in Cytometry. 40:1.21.1–1.21.6.
You made it to the end—nice work! If you’re the kind of scientist who likes figuring things out without wasting half a day on trial and error, you’ll love our newsletter. Get 3 quick reads a week, packed with hard-won lab wisdom. Join FREE here.

Put this article into practice
Choose a free resource to help you move forward
DOWNLOAD
Blood Collection Tube Chart

CHEAT SHEET
Lab Math Cheat Sheet