As we discussed previously, the gaps in our understanding of the human genome make variant classification an extremely difficult job. However, with each passing day our knowledge increases, and the tools to help us become increasingly more efficient.
Let’s pick up where we left off in our first article about variants. After checking Ensemble to learn more about your favorite gene, you need to roll up your sleeves and get down to work — and you should go straight to the dbSNP database.
dbSNP – Single Nucleotide Polymorphism Database
dbSNP is provided by the National Center for Biotechnology Information (NCBI). Here, you can check whether or not someone has found your variant before. dbSNP contains not only SNPs (single nucleotide polymorphisms) but also many other different kinds of variations, such as short deletions, insertions, and multinucleotide polymorphisms.
There are two two major classes of data on dbSNP:
- Data submitted by users that is identifiable using a “submitted SNP” (ss) identifier
- Data produced by combining data from multiple submissions and data from other sources, that is identifiable with a “reference SNP” (rs) number.
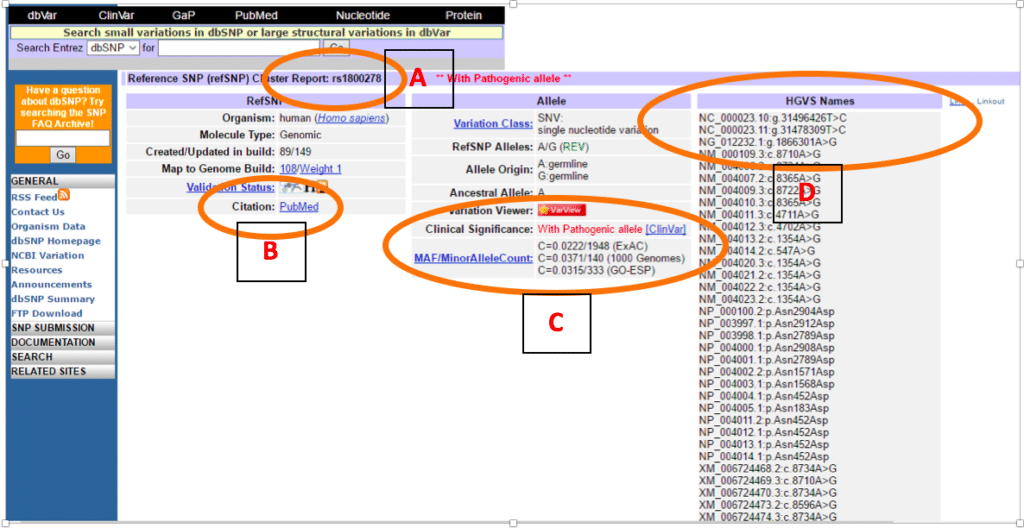
As shown in Figure 1, dbSNP provides a lot of information about your variant. It will show any rs id available (Fig. 1A). In the BRCA2 example here, you can see that dbSNP not only gives some general information, such as nomenclature, organism or molecule type, but it also lists citations about the variant in PubMed, and provides direct links to all citing articles (Fig. 1B).
In the middle column, you’ll find more information about the classification of your variant. Specifically, you can find the Minor Allele Count, or MAF (Fig. 1C). MAF is the frequency at which an allele occurs in a population.
On the third column you will find Human Genome Variation Society (HGVS) names (Fig. 1D) to identify the gene you are studying according to different nomenclatures.
Interpreting the Minor Allele Count
Let’s go back to our Genetics 101 class. Alleles that code for a non-functional protein usually don’t occur very frequently in a population, simply because they are not beneficial, or are disease-causing (let’s think Darwin here). Therefore, their presence in the genetic pool is very low, and we do not estimate the MAF to be high. Think of it this way: how many people with natural blonde hair do you know? More than people with genetic disorders, right?
For example, if an allele occurs in a population with a MAF of 10%, it means that a considerable number of individuals carry this allele, and it is very unlikely to cause disease.
However, even when looking at MAFs we must be cautious. You must know the inheritance pattern of the phenotype you are searching for. Remember, we all have two alleles for each characteristic, with the exception of our allosomes (sex chromosomes).
What Do the Phenotypes Mean?
- An autosomal dominant pattern: the variant is localized in an autosome, and one allele is sufficient for disease manifestation. This type of disease is usually represented in every generation e.g., Huntington’s disease, neurofibromatosis type 1.
- An autosomal recessive pattern: the variant is in an autosome, and two disease-causing alleles are necessary to manifest the disease. This means that the disease might “jump” several generations. e.g., cystic fibrosis, albinism.
- An X-linked or Y-linked pattern: the variant is in one of the allosomes. X-linked diseases may affect both males and females, but Y-linked diseases can only affect males, since females don’t carry the Y chromosome!
Let’s not forget that pathogenic alleles may be hidden in people with a healthy phenotype if the disease follows a pattern of recessive inheritance. Since carrying only one allele does not lead to disease, such an allele can “hide from natural selection” and therefore, may have a higher MAF than we might otherwise expect.
We should also bear in mind that some pathogenic alleles might be beneficial under certain conditions. Confusing, right? For example, being heterozygous for a variant that causes sickle cell anemia is very helpful in places where malaria is endemic. Consequently, in these places, the MAF for sickle cell-associated alleles might be higher.
So, you must know what you are looking for to learn how to accurately read a MAF, and to conclude something from it!
As you can see in Fig. 1C, there is also a clinical significance attributed to the particular variant, and this point leads us to another important database, which is crucial for classifying variants: ClinVar.
ClinVar
ClinVar, also from NCBI, is freely accessible and it shows the relationship between genotype and phenotype, with supporting evidence. In ClinVar, variants are linked to a possible phenotype and to a clinical significance. Clinical significance ranges from: benign, likely benign, VUS (variant of unknown significance), likely pathogenic, and pathogenic.
Every classification is registered by a submitter and each submission is reviewed and validated, both through automated checks and manual curation.
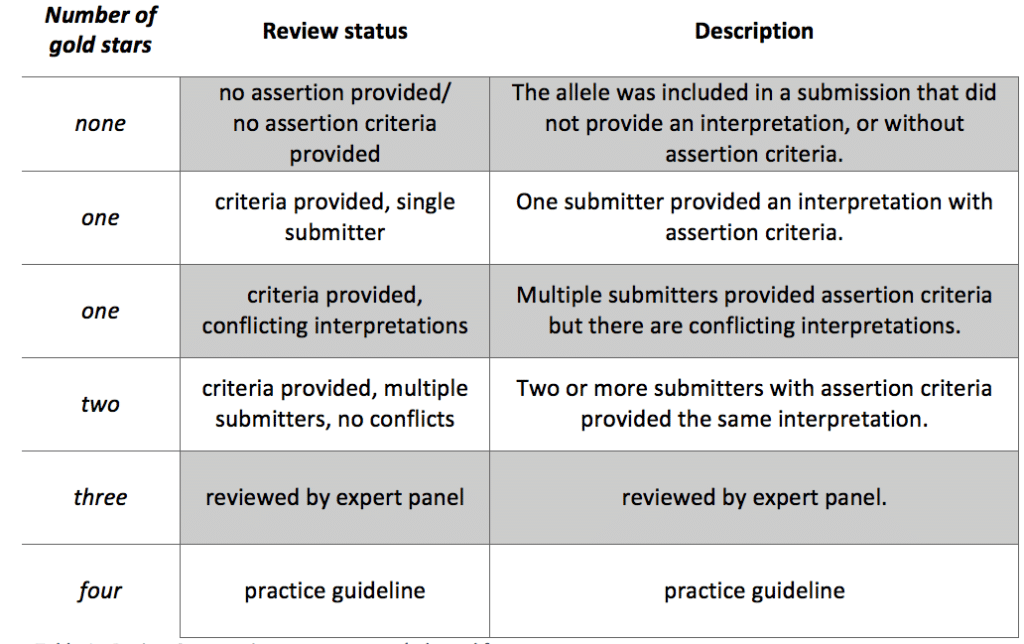
ClinVar uses a system of stars to classify the level of review supporting the assertion of clinical significance for the submitted variant as review status (Figure 2A).
Variants curated by an expert group, or variants included in practice guidelines receive 3 and 4 stars, respectively. The variants that receive this status review are heavily studied and hence the classification is given with more certainty, and is consequently more reliable (Table 1).
How to Interpret ClinVar Classifications
You may find classifications with only one star – it doesn’t necessarily mean that they are wrong. It just means that the particular association between that variant and clinical significance was not submitted many times.
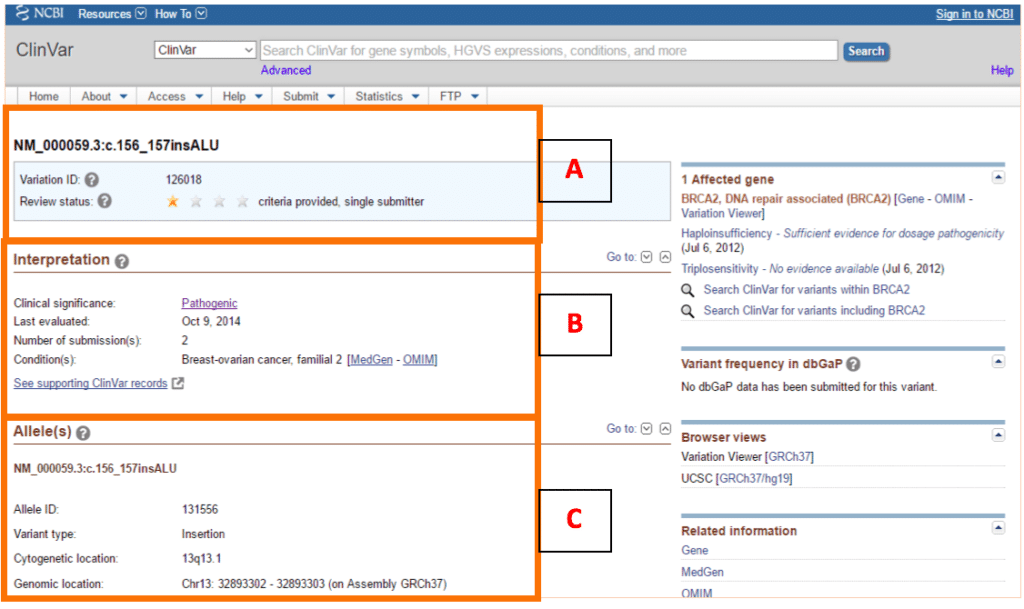
For example, the variant shown in Figure 2 only has one star, but it might still be pathogenic. This variant, in the BRCA2 gene, is indeed pathogenic, as it renders the entire protein useless. Mutations in this gene lead to susceptibility to various type of cancers, like breast cancer. This mutation, in particular, is a founder mutation in the Portuguese population. This means that one or more ancestors of this population were a carrier of this mutation and it has a high frequency in the Portuguese population.
In ClinVar you can easily see the nomenclature of your transcript and variant, and how many stars the submission has (Figure 2A). And, as you look further down the page, you will see any conditions associated with your variant, and a direct link to MedGen and OMIM to learn more about these (Figure 2B). MedGen and OMIM are databases containing curated information on genetic disorders, and they are fantastic resources to learn more about inheritance patterns, phenotypic characteristics, and the mutations more commonly associated with a given disease.
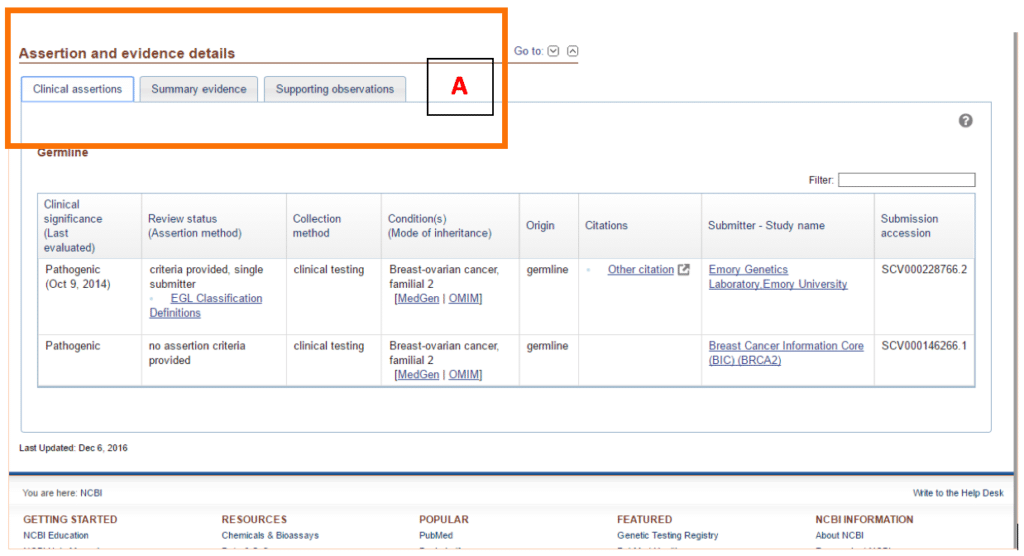
Scroll down to the bottom of the page where you find what is probably the most important piece of information – the “Assertion and evidence details” table (Figure 3A). This table contains three main categories: Clinical assertions, Summary evidence and Supporting evidence, and it is completed by the submitters. It contains all of the information that the submitters used to choose that particular clinical significance, and it will give you more insight into your variant. Browsing ClinVar is pretty straightforward, but if you would like more guidance, then check out this tutorial!
Over to You
I advise you to check out both dbSNP and ClinVar, and play around with them. Click on every hyperlink – it is the best way to learn your way around these databases!
There are additional resources to help you with variant classification, such as: Human Gene Mutation Database (HGMD®), databases for a specific gene and/or condition and in silico prediction tools. Sometimes, you may check all of the resources available, scroll through every database, use all the prediction tools, and still not be 100 % certain of your results. In these cases, you may need to perform functional studies to ascertain whether or not your variant actually has clinical significance.
It is also useful to know that there are a number of sites out there with the purpose of sharing information about variants. You share the information you found on your variant, and what disease you are studying, and somewhere across the globe, someone shares with you their information on the exact same variant. And you know what they say: two heads are better than one. See what database is most appropriate for your research!
And, when it comes understanding our genomes, if we share our information, we will get there much faster!
Classifying variants is a tough job, but someone’s got to do it! I hope you now feel more enlightened, and perhaps less afraid of this daunting job. Remember, there are many people, resources and databases out there, ready to help. You are not alone in your quest to unlock the human genome.
What about you? What resources do you use to understand genomes?
References
Cyrklaff, M., Sanchez, C. P., Kilian, N., Bisseye, C., Simpore, J., Frischknecht, F., & Lanzer, M. (2011). Hemoglobins S and C interfere with actin remodeling in Plasmodium falciparum–infected erythrocytes. Science, 334(6060), 1283-1286.
Kitts, A., Phan, L., Ward, M., & Holmes, J. B. (2014). The database of short genetic variation (dbSNP).
Landrum, M. J., Lee, J. M., Riley, G. R., Jang, W., Rubinstein, W. S., Church, D. M., & Maglott, D. R. (2013). ClinVar: public archive of relationships among sequence variation and human phenotype. Nucleic acids research, 42(D1), D980-D985.
