Flow Cytometry is a great way of seeing how many of your cells express a particular marker and how much of it is there. We do this by measuring fluorescence, but, as with all measuring systems, there will be signal that we are always trying to measure the above the noise. The signal that we see consists of two parts: what we want (the specific staining) and what we don’t want (non-specific staining and background noise). Some of this noise will come from small particles and debris in our samples because, despite what we might think, cytometers are stupid and they will measure anything that goes through them. To ensure we only collect signal and ignore the noise, we use a threshold. A threshold is basically an electronic hurdle that events have to leap over before we measure them.
Using scattered light to determine what is real
In general (but not always) we would apply the threshold, or ‘trigger’, on the forward scatter signal. In most cytometers this defaults to around 5% of the total dynamic range, but we have the ability to alter this. So, in what circumstances would that be useful?
Let’s consider whole blood. Even if there has been a red blood cell lysis step, there will often be quite a lot of debris, red cell ghosts, and, possibly, unlysed cells. In general, because we are interested only in the mononuclear cells, we wouldn’t want to look at these. There are two ways of excluding them – we could gate them out in analysis or we could alter the threshold to avoid acquiring them in the first place.
There are a couple of things to bear in mind when considering which approach to use. If we leave unwanted cells in our file, the file will contain a lot of things we aren’t interested in and increase the file size. If we increase the threshold, anything beneath that will be invisible to the cytometer, and we will never acquire that data. So, it’s a balance, and indeed personal preference, which way we do this.
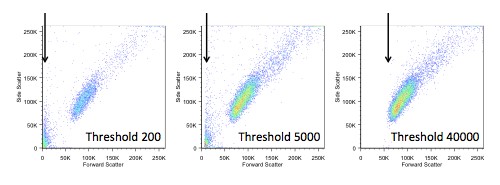
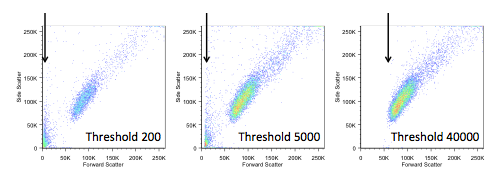
If we do choose to change the threshold, we also have to be careful not to make it too high, as we would start to lose data. In the figure below, you can see the ‘white space’ that appears on the left when we increase the threshold.
Would we always use scatter?
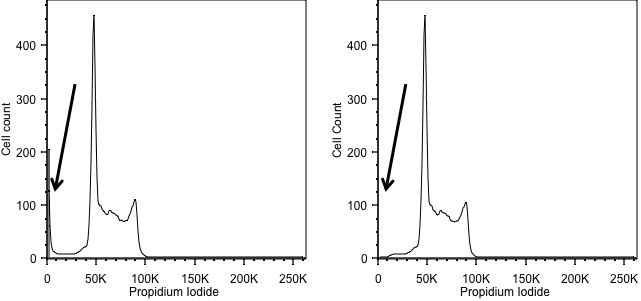
Forward scatter is generally used as the thresholding parameter. However, there are some occasions when we might want to change this. An example of this would be DNA analysis. Here we are only interested in cells with a nucleus. So, we can exclude events we don’t want simply by using the signal from the DNA stain as the threshold, allowing us to exclude anything that has no, or little, DNA. In the figure below, the left hand panel shows data acquired using a threshold on forward scatter and we can see events with little DNA content on the y axis. These disappear when we threshold on the DNA signal in the right hand panel.
On most flow cytometers, you can combine parameters to create a more complex threshold – for example, using the DNA signal AND forward scatter.


Sorting needs special consideration
This all seems straightforward and for analysing samples by flow cytometry it soon becomes second nature. More care is needed when we are sorting cells. Quite often we are sorting cells for downstream molecular biology applications, where we need as clean a sorted population as possible.
If we threshold out events in a cell sorter, although they are invisible to the electronics and not seen or counted, they are still there in the sorted drops. This may not matter too much if we are sorting for re-culture, but if the downstream application is something like PCR, it can be a problem. So, in sorting experiments we need to keep the threshold as low as possible so we can see – and therefore exclude – everything we don’t want. Sample preparation is extremely important in all cytometry experiments, but even more so in sorting!
For something that has a simple premise there are several pitfalls for the unwary, but, hopefully this article has highlighted those and all your experiments will be perfect!