
No matter how we make measurements, there will be variation (a spread of data). Take 100 people and ask them to guess your age and you will get a range of results: some will be too low (excellent!), some too high (not so good!).
It is the same with any of our laboratory experiments – if we pipette liquid 100 times we won’t dispense exactly the same amount of fluid each time. And, in flow cytometry, if we measure the same cell 100 times we don’t get exactly the same result each time: there will be some data spread. Some of this is due to the sample itself, some due to the fluorochromes we use and some due to the cytometers and their capture and quantitation of the signal.
But we know that variability exists in our flow data and we know we have to deal with it, so we always want to try to quantitate the amount of spread. This is important because the greater the spread, the harder it will be to say that distributions are significantly different.
In our flow cytometry measurements we want to keep variability to a minimum which we can do by careful experimental planning, thinking about reagents, titration of antibodies and making sure we only measure what we want by excluding dead cells and clumps.
Choose a free resource to help you move forward
DOWNLOAD
Blood Collection Tube Chart
CHEAT SHEET
Guide to Pipette Cleaning
But we are always dealing with nature – even if we are just looking at CD4 positive cells in peripheral blood, not all cells will have exactly the same level – meaning within an individual sample and between multiple patients there will always be a spread. It follows therefore that we can look at data spread within our individual samples or within a series – here we will look at assessing spread in individual samples.
Luckily we can do this in statistical terms with several different metrics.
The range
The range is the difference between the highest and lowest values. Sometimes we won’t look at the whole range but a subset – the interquartile range. This is the area where the middle 50% of the data lies. These metrics can be useful in some situations (where there is a non-normal distribution for example) but they do not help us much when comparing between distributions.
The spread of data
It is better to look at the spread or variation around the mean of a data set and we do this by two measurements:
1. Standard Deviation
The standard deviation (SD) is defined as the average distance of each point from the mean, or mathematically:
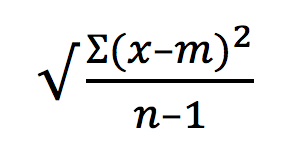
Where ? = the sum of, x = each value in the population, m= the mean of the values, n = the sample size.
Although this is useful it is harder to compare results between experiments or, in flow terms, samples that have been run on different machines which may have different levels of data resolution. This is because even if distributions have the same spread the absolute value will change depending on where the mean is.
To get round this we can use another metric:
2. Coefficient of Variation
The coefficient of variation (CV) or coefficient of variance is defined as:
(SD/m) × 100
As CV is expressed as a percentage it is unitless and dimensionless. So this is what we generally use when we want to compare results over time, between machines or between sites.
In practical terms, the lower the number the less the variation there is. To think why CV is generally a better measure for comparing across platforms, consider two distributions that have the same relative spread of about 10%. If the mean of one is 100, it will spread between 90 and 100, but if the mean is 1000, it will spread between 900 and 1100. Different SDs but same CV.
So where do we uses these metrics in our cytometry experiments?
Quality Control
We look at CV when we running Quality Control tests – we check alignment of our cytometers using single peak beads which are very uniform and will have low intrinsic variation and therefore a low CV – we can monitor this and it tells us that our cytometer is performing optimally.
DNA analysis
To be able to best tell cells in G1 from those in S we need the CV of the G1 peak to be as low as possible. We have seen how this can be done in a previous Bitesize Bio article and Figure 1 shows the difference between a sample with low CV (left) and high CV (right).
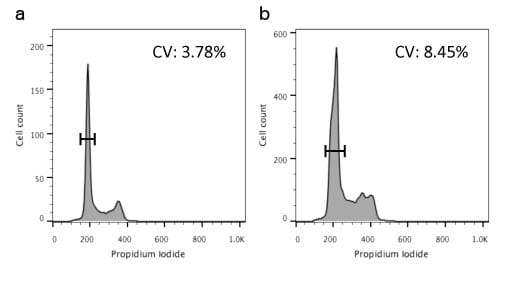
Figure 1. Differences in CVs between samples. a) Sample with low CV; and b) sample with high CV.
Cell Proliferation
When using the dye dilution technique to be able to tell generations apart we need a low CV and the value of this will give us confidence (or not!) in the results.
Knowledge of these relatively simple statistical metrics will help you assess your experiments and form the basis of further tests that you can apply it to assess the significance of your results.
You made it to the end—nice work! If you’re the kind of scientist who likes figuring things out without wasting half a day on trial and error, you’ll love our newsletter. Get 3 quick reads a week, packed with hard-won lab wisdom. Join FREE here.


