It strikes fear into the hearts of new cytometrists. Compensation. More fights have started over the proper way to compensate at meetings than anything else. This article will strive to shed some light on the principles of compensation, and equip you with the tools necessary to achieve compensation mastery for your research experiments.
Compensation is one of the most critical, and yet poorly understood topics in flow cytometry. Like setting the proper voltage and knowing where fluorochromes excite and emit, it is critical to successful cytometry. Understanding compensation is rooted in an understanding in the physics of fluorescence. It is the consequences of fluorescence and the construction of our cytometers that lead to the need for compensation.

It all starts with fluorescence; that is, the emission of a photon of light from a molecule that has absorbed a photon of light of a lower wavelength. In the process of excitation, the fluorescent molecule is excited; that is, an electron is moved to a higher energy state. To release that energy, the molecule emits a photon of a higher wavelength. As shown in the Figure 1 for fluorescein, this emission occurs at a maximum of about 519 nm, but stretches out far into the orange spectrum (over 600 nm).
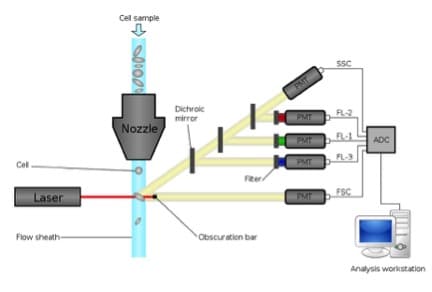
The problem comes in when we wish to measure this fluorescein signal. As we’ve discussed previously flow cytometers use photomultiplier tubes (PMT) to convert photons to electrons. PMTs will generate a photocurrent if any photon strikes them; therefore, we use filters to restrict the light going to each PMT. In Figure 2, below, the fluorescein signal is being measured in the BandPass 530/30 filter. However, as you can see, there is a percentage of this signal also in the 585/42 filter (approximately 12%). This is the spillover of fluorescein into the phycoerythrin (PE) channel.
Enjoying this article? Get hard-won lab wisdom like this delivered to your inbox 3x a week.

Join over 65,000 fellow researchers saving time, reducing stress, and seeing their experiments succeed. Unsubscribe anytime.
Next issue goes out tomorrow; don’t miss it.

This spillover is manifested in our data plots, as shown in Figure 3. Based on this plot, which shows human PBMCs (peripheral blood mononuclear cells) labeled with fluorescein-labeled antibody, a signal is observed in the PE detector. The signal we want is shown in the green arrow. The spillover can be seen as the red arrow.

Compensation is the process of correcting the spillover from our primary signal in each secondary channel it is measured in.
At the most simple level, we are calculating a slope of the line drawn between the medians of the unstained and the fully stained populations. As shown in Figure 4, that slope is what we then use to correct our signals.

If you are using an instrument and still performing manual compensation, please ensure you are using statistical data to generate this value.
The more accurate and gold standard for compensation is automatic compensation. It is derived from a paper by Bagwell and Adams (1993) (Ann NY Acad Sci 20:167-184). As described in that paper, and shown in Figure 5 (Figure 2 from Bagwell and Adams’ paper), there are several ways to do this, but the most accurate method is to use automatic compensation (Herzenberg et al. (2006 Nature Immunol 7:681-68) among others). There is no reason an investigator should be performing manual compensation with the propagation of different tools for the job. If you run a flow cytometer that does not have an automatic compensation package, it is best to collect your data uncompensated and use a third party software package to perform compensation. Automatic compensation is accurate as long as you follow the three basic rules of compensation (see below).

So why do we compensate?
First is our reliance on one- and two-dimensional visualization and gating tools. In fact many of the current clustering packages being developed require compensated data before they can be run. Secondly, we need to ensure that contributions from fluorochromes not being displayed don’t affect the distributions of the data.
Basic Rules of Compensation
Compensation requires that three rules be followed. These rules are:
- Controls need to be at least as bright as any sample will apply the compensation to.
- Background fluorescence should be the same for the positive and negative control populations for any given parameter.
- Your compensation color must be matched to your experimental color.
And a bonus rule – collect enough events.
Compensation is required for a flow cytometry experiment because of the physics of fluorescence. A fluorochrome is excited, and emits a photon in a range of wavelengths. Some of those photons spill into a second detector, causing single stained samples to appear double positive. We apply a mathematical correction to our data to address this spillover – this is compensation.
Proper compensation requires adherence to three fundamental rules, and all compensation problems result in not following these rules. In the next installment, we will discuss and dispel some of the myths of compensation.
Originally published on May 6, 2013. Updated and revised on August 11, 2015.
You made it to the end—nice work! If you’re the kind of scientist who likes figuring things out without wasting half a day on trial and error, you’ll love our newsletter. Get 3 quick reads a week, packed with hard-won lab wisdom. Join FREE here.