What if there was a way to take the power and speed of a flow cytometer and couple it with the resolution of a microscope?
Imaging flow cytometry does just that!
Flow cytometry is a very powerful tool for the complex characterization of cells and cell populations but flow cytometers can also be thought of as microscopes with very poor spatial resolution. Increase the resolution and you have a machine that can provide comprehensive analysis and in-depth imagery of every individual cell.
The Early Years
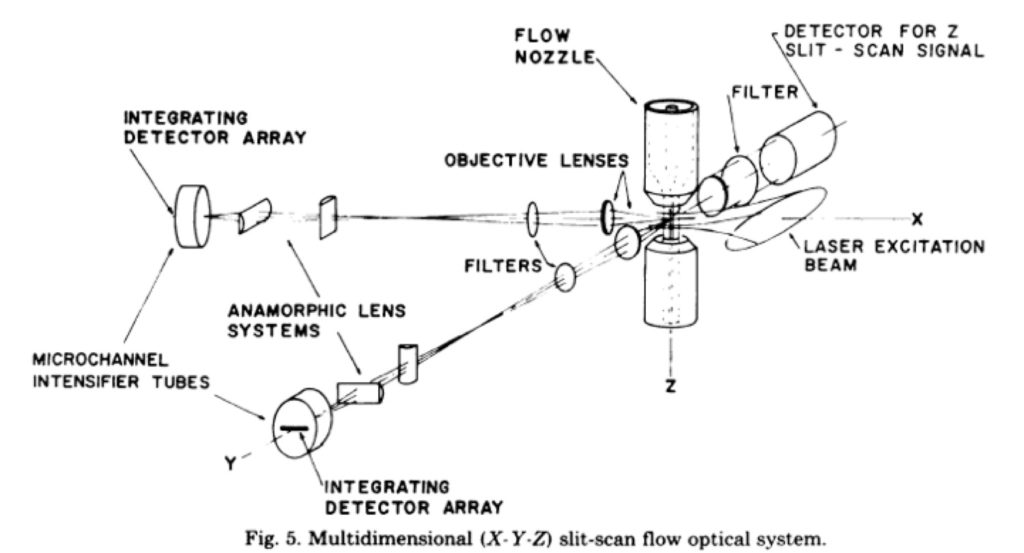
The details of the first imaging flow cytometer were published in an article from Leon Wheeless’ lab at the University of Rochester (Kay et al., (1979) J Histochem Cytochem 27:329). That system was a slit scanner based system with two detectors. The schematic of this system is shown below.
The system was able to make simple measurements. Using Acridine Orange, the nucleus of the cell could be detected, as well as the RNA in the cytoplasm, helping to determine the cell boundaries. The data from this system looked like this:
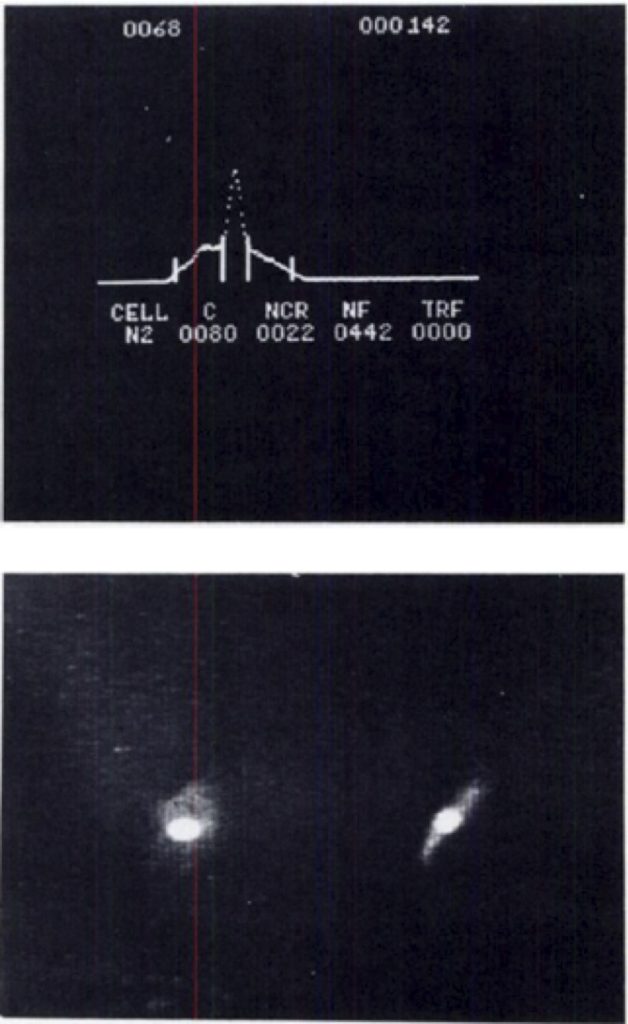
The top figure shows the automatic identification of the cell, including the nucleus (in the center) and calculations for the cell size and nuclear to cell ratio. The bottom image shows the cells and nucleus (bright signal). The right image is shown 90 degrees from the left image.
The ImageStream
It took over twenty years before this technology was further developed. The intervening years saw improvements in detection systems, optics, and tools for measuring moving cells allowing the images to remain in focus. With these improvements George et al ((2004) Cytometry A 59:237-245), developed a new instrument, called the ImageStream (marketed by Amnis, now part of EMD Millipore).
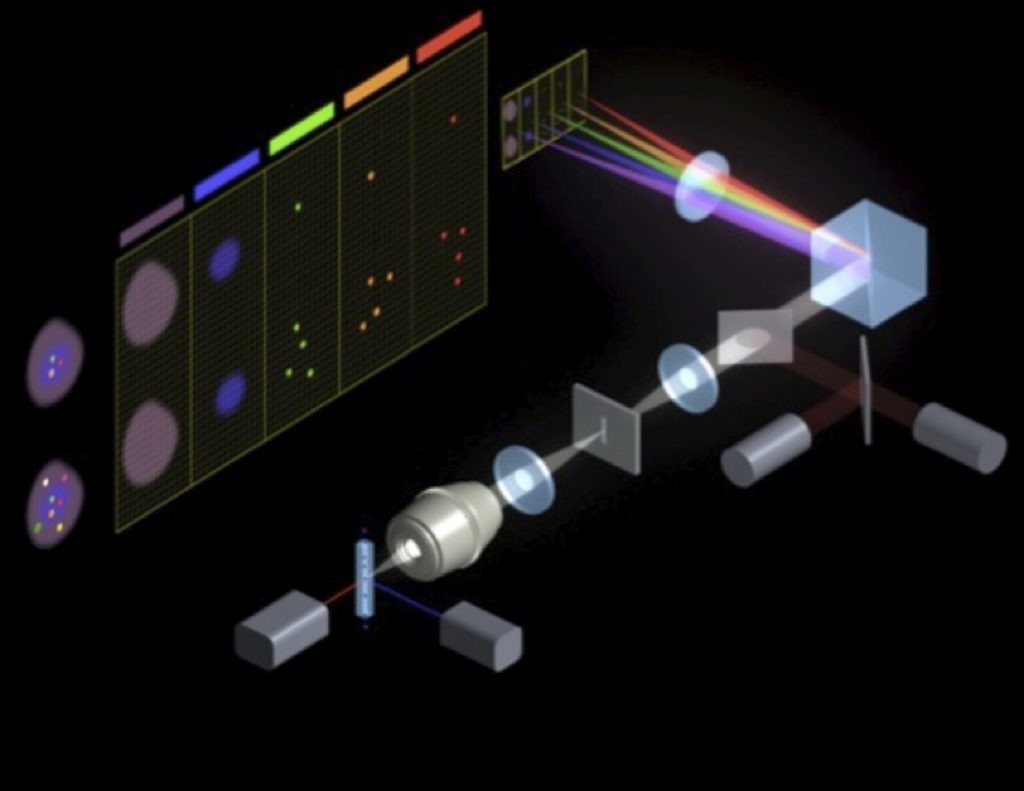
The ImageStream uses a custom CCD camera chip with a fanned filter stack so that specific wavelengths of light are directed to defined areas of the CCD chip. Additionally, to ensure that the cells are in focus, and to get the maximal signal, the ImageStream relies on a technique developed for measuring low light moving objects. This Time Delay and Integration (TDI) relies on a second laser and a co-injected bead. The velocity of the bead is measured to calculate velocity, and is characterized by two PMTs, set slightly ahead and behind the optimal focal plane for the flow cell. By keeping these two signals in balance, the ImageStream keeps the cells in the optical focal plane for the optics. The schematic for the first generation instrument is shown below.
Some of the limitations of the first generation instrument included the fixed lens (40X), capability for only 4 -color fluorescent detection, lack of automation and relatively slow acquisition rate. These were addressed in the second generation ImageStream.
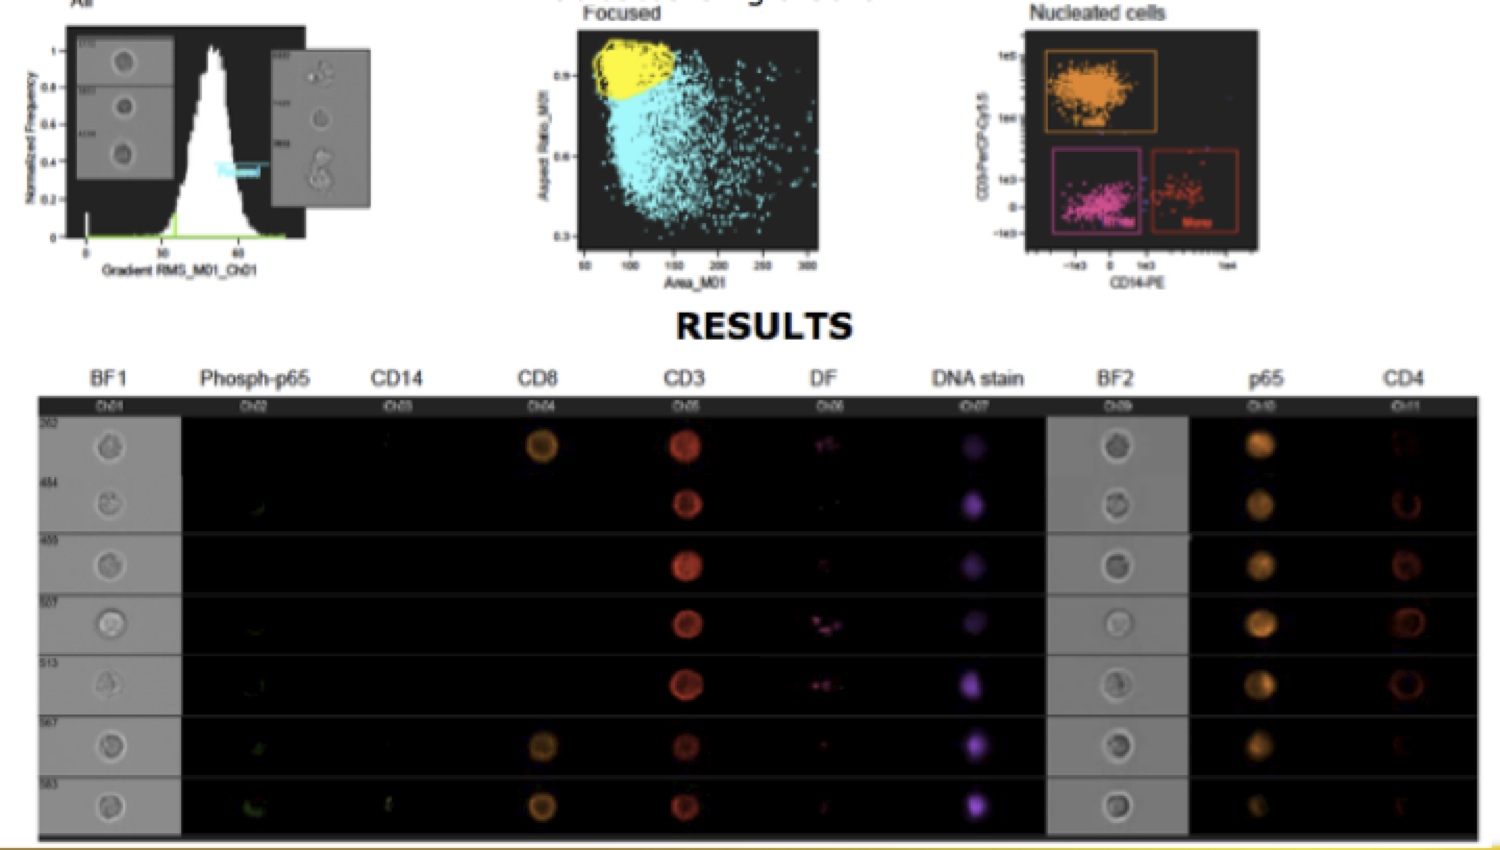
The second generation ImageStream has two cameras, allowing for up to 12 simultaneous images (9 fluorescent). Additionally, it has up to three magnification lenses (20, 40 and 60X), extending the ability to image both larger and smaller cells. There is also an auto sampler, allowing for walkaway acquisition and the system acquisition has been increased. Sample data is shown below.
The Power of Imaging Flow Cytometry
Imaging Flow Cytometry, sometimes called Multispectral Imaging Flow Cytometry (MIF-C) using instruments such as the ImageStream opens up a host of applications. It allows for the morphometric characterization of cells in addition to fluorescent imaging. More importantly, the software called IDEAS allows for the analysis to be performed using the tools well known to the flow cytometrists – such as histograms and dot plots, making morphological analysis readily accessible. It also allows the research to look at any cell by simply selecting a dot (on a dot plot).
Some of the applications that can be performed include:
- Co-localization of two proteins
- Binding of two cells
- Changes in morphological changes
- Immune synapse formation
- Nuclear translocation
Taken together, imaging flow cytometry extends the power of traditional fluorescent cytometry by adding morphological information. This allows the researchers to bridge the rich literature of microscopy morphological characteristics to the power of phenotypic characterization.