In recent years, three-dimensional (3D) scanning electron microscopy techniques have gained recognition in the biological sciences. In particular, array tomography, serial block face scanning electron microscopy (SBFSEM) and focused ion beam scanning electron microscopy (FIBSEM) (described in Three-Dimensional Scanning Electron Microscopy for Biology) have shown an increase in biological applications, elucidating ultrastructural details of cells and tissues across a variety of different sample types.
In standard electron microscopy, such as brain cancer electron microscopy, sample preparation and data analysis takes more time than sample imaging. The time required for data analysis increases exponentially when you use 3D EM techniques. Thus, the two main challenges in 3D analysis are having enough research time and computer power to process the datasets.
Both necessary time and computer power vary depending on the type of information required from the data and the software used.1–2 To accommodate the different needs, there are a variety of techniques and software packages available at each stage of the 3D SEM data processing and analysis process.2–3 The stages, with a brief outline of the available options, are below:
Alignment and Stacking
Array tomography, SBFSEM and FIBSEM produce data in the format of a series of sequential images. Each image is captured from the surface of a sample. For array tomography, the sample is a physical slice of the specimen while the sample for SBFSEM and FIBSEM is the sample itself after a slice is removed (see Three-dimensional Scanning Electron Microscopy for Biology for details). You need to stack and calibrate the resultant images (in the header information of the data stack) to correspond with slice thickness and generate correct z-axis and voxel (3D pixel) dimensions (Fig. 1).
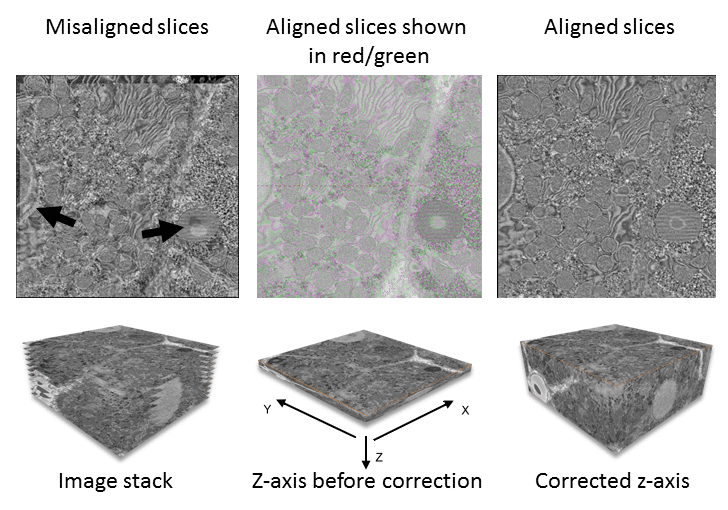
In addition to z-axis stacking, images often require alignment to each other (registration) because of drift between slices or, in the case of array tomography, because sections on the substrate are in slightly different orientations. In other instances, you may have to remove individual from the data stack to avoid skewing the rest of the data (for example, if debris has fallen across one of the slices, obscuring the sample and creating an extreme brightness and contrast range).
Filtering and Binning
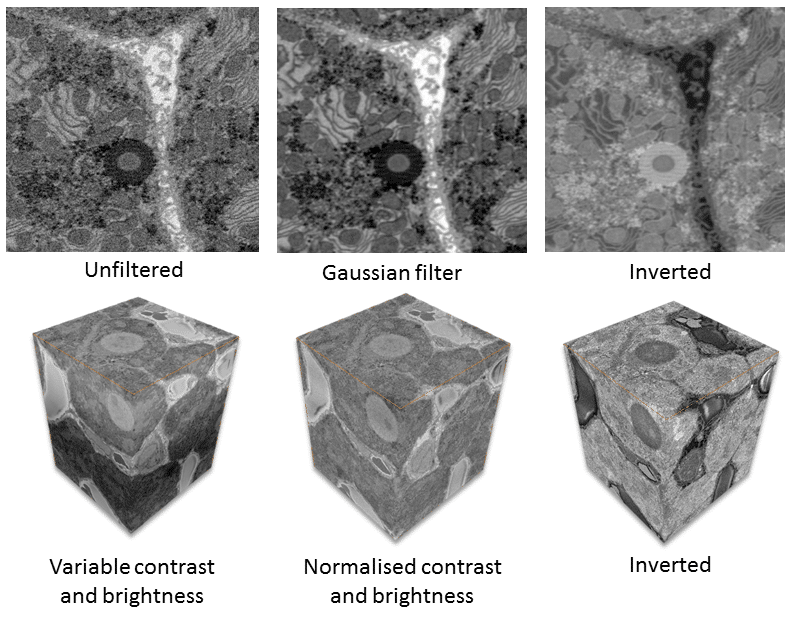
3D SEM techniques commonly experience noise and reduced contrast. Therefore, filtering is important to optimize the data output. There are several types of filtering and processing steps you can apply to the data stack. The processing steps you use depend on the original image data and the type of information you seek. Common data processing steps include:
- normalizing the contrast and brightness across all images
- noise reduction
- inverting data and
- data binning
In addition to reducing noise, data binning also decreases the size of the data, making subsequent processing steps faster (Fig. 2).
3D Data
Most data processing software display a 3D stack of images. You can use original image files, if you have the slice thickness. However, more often you will use images derived from an assembled 3D data file, which has been filtered and processed as outlined above. This is particularly true for very large datasets; they often cannot be displayed until some level of binning is applied.
At this stage, you can conduct a basic analysis of ultrastructure and quantification of repeating features. Often, however, the complex spatial arrangement of structure will require modelling. You can also trim the data once the region of interest has been identified, to make it easier to handle and process.
Segmentation
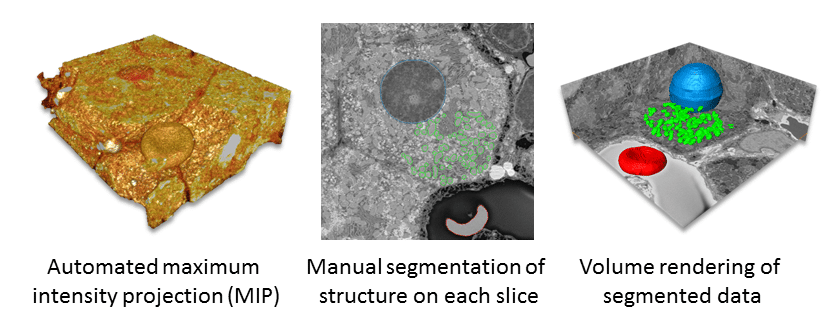
Segmentation aids in interpretation of structure and enables quantification. Consequently, researchers frequently apply this technique to 3D SEM data is (Fig. 3). In this process, data is subdivided based on ultrastructural characteristics and reconstructed as a 3D model. Segmentation is either fully automated, manual or a combination of the two.3 The segmentation process takes the greatest amount of time.1 Detailed reconstructions, even with some automated segmentation, can take months and many people to achieve significant results.4–5
Quantification
One of the most exciting aspects of 3D SEM is the potential to obtain significant replicates for quantification. The software and extent of data processing determines the type of quantification you can achieve. The greatest range is obtained with segmented data. For example, you can obtain volume and surface areas of segmented volumes as well as make manual measurements for length and distance. More complex measurements include feret diameters, sphericity, eigenvalues and eigenvectors, distribution of structure and distances of objects from specified points. You can do this across multiple cells, organelles or tissues to obtain statistically relevant information.
Display and Data Output
3D data also lends itself to more dynamic forms of presentation, along with more traditional images of modeled data and quantification results.
Video 1 shows sequential SBFSEM images of liver tissue.
For example, you can make simple videos that scan through original images (Video 1), rotate segmented or reconstructed models (Video 2) or create stereoscopic images on posters, virtual reality visualization and 3D printed models.5
Video 2 shows rotation of the model in figure 3.
Specific file formats vary, but you can usually find a range of options that are engaging and informative for presenting results to peers and the general public.
That gives you an overview of the possibilities. Check out the reference list below for more information.
- Peddie, C. J. & Collinson, L. M. (2014) Exploring the third dimension: volume electron microscopy comes of age. Micron, 61:9-19.
- Borrett, S. & Hughes, L. (2016) Reporting methods for processing and analysis of data from serial block face scanning electron microscopy. Journal of microscopy, 263:3-9.
- Kittelmann, M., Hawes, C. & Hughes, L. (2016) Serial block face scanning electron microscopy and the reconstruction of plant cell membrane systems. Journal of microscopy, 263:200-11.
- Helmstaedter, M., Briggman, K. L. & Denk, W. (2011) High-accuracy neurite reconstruction for high-throughput neuroanatomy. Nature neuroscience, 14, 1081-8.
- Kim, J. S. et.al. (2014) Space-time wiring specificity supports direction selectivity in the retina. Nature, 509:331-6.
- Hughes, L. (2015) 3D printing for biological electron microscopy. Microscopy and Analysis, 138:14-8.