De Novo DNA Sequencing and the Special k-mer
The technology for DNA sequencing was developed back in 1977 thanks to Frederick Sanger. It took a bit longer before it was possible to sequence a complete genome. This is because we needed an appropriate mathematical model and massive computational power to assemble millions or billions of small reads to a larger complete genome. Today’s computational power and software are the main difference between what used to take years of work in the early 2000s and what only takes only a few hours today. The algorithm you chose to do this is the “holy grail” of the assembling technology. These algorithms incorporate one of the most famous variables known in mathematical models, the k-mer.
The origin of the k-mer and the mathematical model that surrounds it comes from a 1735 Swiss mathematician Leonhard Euler, who is known as the father of the mathematical function. A Dutch mathematician Nicolaas de Bruijn adapted Euler’s ideas to find a cyclic sequence of letters taken from a given alphabet for which every possible word of a certain length appears as a string of consecutive characters in the cyclic sequence exactly once.
de Bruijn’s algorithm was adapted by molecular biologists, who many years later faced an equivalent problem: how to assemble DNA sequences. Thus, scientists all over the world now use the De Bruijn graph and the variable k.
Application of k-mers to Assembling DNA Sequences
In a few words, de novo genome assembly involves connecting consecutive small DNA reads and ending up with larger sequences. To generate a de Bruijn Graph (see the figure below), the nucleotides at the edge of each read must overlap the edge of a second one (and so on). The final goal is to create a consecutive vertex, which (potentially) will result in large DNA fragments.
You have to fragment your reads into k-mers, which are a specific number of nucleotides that overlap. The k-mer allows you to generate a unique sequence from many small ones. Each unique k-mer sequence is identified and extra copies are eliminated. This aspect of k-mers allows you to overcome one of the drawbacks of next generation sequencing — getting reads that represent genomic regions with different frequencies (i.e., getting a lot of small reads from one region). The use of k-mers eliminates sequences repeated more than once because of unequal sequence coverage. However, keep in mind that a low k-mer size will increase the chances for nucleotides overlapping, while having a larger value will decrease them.
Today’s de novo assembly technology is more efficient when you use libraries of large reads (i.e., 1.000–10.000 bps) combined with smaller ones (100–200 bps). Software programs can use the k value and k-mers to assemble short reads. These can then be incorporated and verified by larger ones to end up in more accurate contigs.
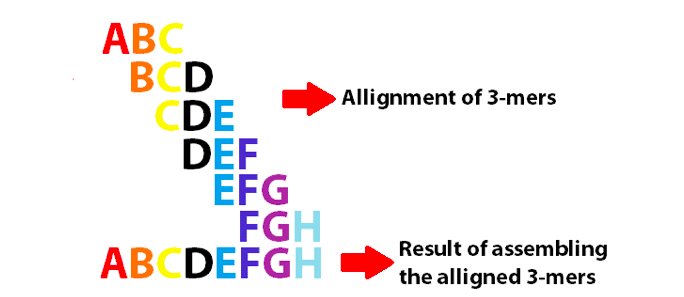
Example of a de Bruijn graph using 3-mers to assemble the 8 first letters of the English alphabet. Note that these 3-mers overlap as k-1.
The More You Know the More You Can Achieve in DNA Assembly
There are specific tips you need to consider before applying De Bruijn graphs in your assembly method and choosing the most appropriate k-mer size. By harnessing these, you can generate better results.
- First of all, and maybe most important, is to use many different k-mers in your assembly. You should then evaluate your results and choose the best one(s). Never forget that there is almost never one and only one correct assembly.
- You should carefully handle error reads, before using a k-mer. If you do not carefully remove the errors, the results can create an unwanted bulge, complicating your assembly. Increase the threshold for the error rate you use during sequence trimming. You might lose some sequences, but those who remain will be the finest.
- You should handle carefully DNA repeats. For example, Illumina sequencing generates a very large amount of data. First, try to assemble a small fraction of the reads, and then use them all to spot differences. Repeatable short reads might interfere negatively with your assembly process.
- Know your data. If you do not know the size of your expected genome, the amount of sequencing coverage, and the number of reads, then you are more prone to choose the best k value for assembling your genome. You can visit k-mer advisors, like velvet advisor from Monash university to get some advice about which value seems more suitable.
Using k-mers of various lengths and aligning the contigs also helps researchers to spot mutation rates, expanding its use. Of course, manipulating De Bruijn graphs towards assembly benefit is not a panacea. There are numerous things to consider than a simplistic function for assembling the genome of a live organism. This is just an introduction of the history and how biologists can use it more efficiently.
References
- Compeau PE, Pevzner PA, Tesler G. (2011). How to apply de Bruijn graphs to genome assembly.Nature Biotechnology. 29(11):987–91.
- Aggarwala V, Voight BF. (2016). An expanded sequence context model broadly explains variability in polymorphism levels across the human genome. Nature Genetics. 48(4): 349–55.