FlowJo Software: how’s your FlowJo mojo?
Generally, once you’ve acquired your samples on a cytometer, the hard (but hopefully fun!) part of making sense of all the data begins. This can be increasingly complex depending on the number of cells, populations, parameters, and combinations. So where we use the dedicated software aligned to the analyser for acquisition, we frequently use alternative programs for offline analysis.
Advantages may be that such software is much more user-friendly for large scale analysis rather than the instrument-linked software (although there are usually analysis tools here too), and it can unify the analysis approach and presentation, so irrespective of what user or cytometer, the data “looks” the same.
But with the variety of software available how do you know which one is right for you?
In this series of articles we are going to be looking at a range of software that is available to you for your cytometric analysis and give you the low down on each one, highlighting the strengths and weaknesses so you can make the decision of which software is best for you.
We are starting this series off with FlowJo, which has become very popular, in particular among many in the immunology world who may have large complex datasets.
Analyzing Your Data with Flowjo
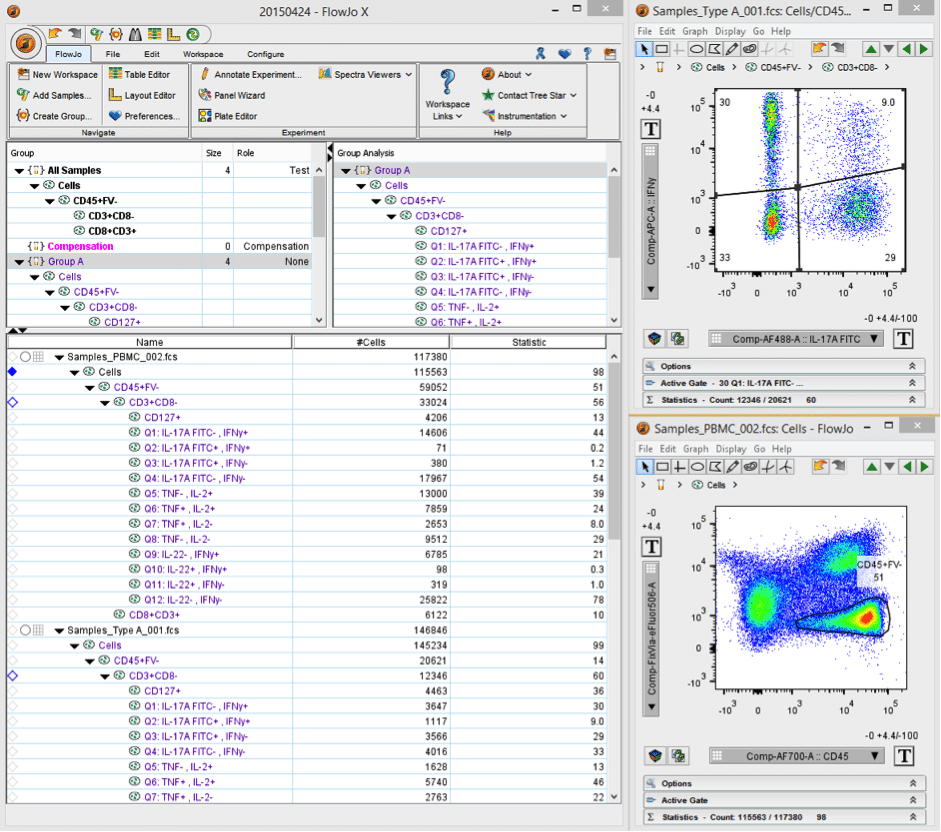
Essentially FlowJo is solely analysis software, though it does run acquisition on reconditioned cytometers by Cytek Development (“FlowJo Collectors’ Edition”). The core of the program is based around its workspace (Figure 1) and this is where you add all your samples, create various gates and statistics, and set up groups, etc. You can set it up according to your general specifications (e.g. # of samples, events and stains, species and cell type, etc.) and this can help FlowJo perform optimally. Much of the power of FlowJo comes from the ability to apply gates and statistics set up on one sample to all samples in a given group or workspace. This tends to make analysis relatively straightforward, quick, and painless.
Figure 1. Screenshot of FlowJo workspace.
There are plenty of other features, from redoing or checking the compensation settings of any sample and manipulating biexponential plots, to creating fancy gates (spider/ curly/ auto gates) and batching overlay plots against a given control. Remember gates are not carried over from the acquisition so you’ll always have to do them from scratch. Also, a good tip is to make sure you do all your gating on one sample, then apply to the others and check to see if they’re correct for all samples. I like to set up on a positive-stained sample, apply to all and then check the gating on my controls (experimental/FMO/iso/ comps.).
Presenting your data
Once we’ve done the core of our analysis on the workspace, we can decide how we want to present our data, and we have a lot of features here to play with. We can decide what type of plot we want to display and how we want it to look (pseudocolor, density, contour, zebra, histogram, with/without outliers, large/small dots… plenty of choice here!), and what details we want to include/exclude (gates, names, numbers, labels, legends). Just like the workspace batching, once we’re happy with how we have one looking, we can apply to any group and it will create such plots for all. We can then print this out, or copy it over to PowerPoint or other program of choice, or whatever we so choose. Similarly we can generate and batch multiple statistics, and then export to Excel, Prism or the likes for further analysis or presentation.
In addition, we can use the FlowJo generated analysis to do further analysis or presentation. For example, SPICE software, created by Mario Roederer’s team in NIAID, is particularly suitable for analysing large data sets from polychromatic flow cytometry, and arranging it into accessible graphs and displays. It is an excellent freeware tool, but bear in mind it’s only compatible with Mac versions of FlowJo (OS X or later), so mind that you don’t spend hours preparing it on PC only to have to redo it!
Cost and Compatibility
This software can analyse data from all common, and not so common, cytometers, although the data may have to be exported in a particular format to be read. FlowJo is frequently releasing new versions so you will find both current and legacy versions (think MS Office 2013, 2010, 2007…), it is available for both Mac and PC, and it’s often a case that people will have their own preferred version. The FlowJo website has plenty of quality tutorials, videos, and webinars, and are pretty fast in responding to your questions.
You don’t get all the bang without putting down some buck and this software certainly isn’t free (there are lots of different options, depending on academic/industry, single/multiple licenses etc., but be prepared to pay >$2000 for a single licence). FlowJo does have institutional licences so it’s worth checking if your institution has a licence already. If you’re not sure about the software you can take it for a test drive with a 30 day free trial. You can get a variety of licensing options such as Server Licenses, Permanent Licences, or dongles; which one is best depends on what you want to do, and your budget.
So that’s it in a nutshell. Hopefully you’ll find FlowJo pretty intuitive, with a lot of drag & drop, and right-click functions. Remember: once the acquired raw data has been saved, nothing can really go wrong that can’t be fixed so take your time and play around to make sense of it all, and see if it helps keep the analysis juices flowing.
Stay tuned for or next article on cytometry analysis software.