Let’s Talk About Stats: Methods for Comparing Two Sets of Data

Statistical data comparisons are necessary for selecting an appropriate sample size, calculating efficacy, and publishing results. Two common tests, the Student’s t-test, and the Mann–Whitney U test, are often used when comparing two sets of data. Student’s t-test is commonly used for normally distributed continuous data, while the Mann-Whitney U test is non-parametric and suitable for unpaired samples, making no assumptions regarding the distribution or similarity of variances.
What’s the best way to compare two sets of data, and why would you ever need to do it?
Selecting an appropriate sample size, calculating the efficacy of your results, and publishing your work may, depending precisely on what you do, rely on statistical comparisons of data. Comparisons have to be fair, accurately represent the data, and show if what you think they show is statistically significant.
In this article, we break down two of the most common tests used to compare datasets (the Student’s t-test and the Mann–Whitney U test), their differences, and some of their assumptions.
Comparing Two Sets of Data
When comparing two sets of data, you have to make decisions that dictate how you will make the comparison. The first decision is based on how many datasets you want to compare (Figure 1).
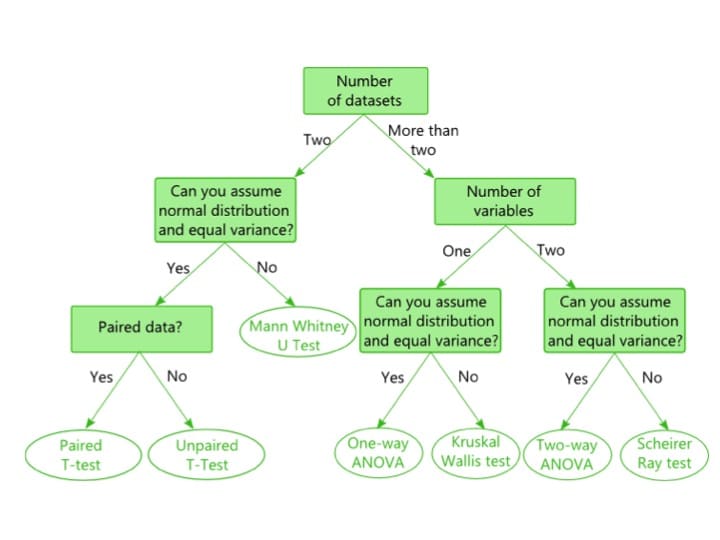
As mentioned, this article focuses on comparing two sets of data. Read this article to learn more about comparing multiple datasets.
When you are comparing two sets of data, you have two main options. These are:
- Student’s t-test
- Mann–Whitney U test
Let’s learn about these tests and when they apply.
1. Student’s t-test
The Student’s t-test (or t-test for short) is the most commonly used test to determine if two sets of data are significantly different from each other.
Interestingly, it was not named because it’s a test used by students (which was my belief for far too many years). In fact, the Student’s t-test was created by a chemist, William Sealy Gosset, who worked for Guinness (yes, the beer company).
Gosset used the pen name “Student” to prevent other breweries from discovering Guinness’ use of statistics for brewing beer. Who would have thought that statistics and alcohol go so well together?
To perform a t-test, your data needs to be continuous and follow the normal distribution (data are distributed evenly about the mean).
Plus, the variance of the two sets of data needs to be the same. Why not brush up on your statistical terms if you’re a little rusty?
The t-test comes in both paired and unpaired varieties. In general, most data in biology tends to be unpaired.
If you’re not 100% sure whether your data is paired, err on the side of caution and assume it isn’t (and read the article on statistical terms I just plugged).
You can use an unpaired t-test on paired data without negative consequences. However, if you use a paired t-test on unpaired data, you can get a significant result when there is actually no significance and obtain a so-called Type 1 error.
2. Mann–Whitney U test
The Mann–Whitney U test, also called Mann–Whitney–Wilcoxon (MWW), Wilcoxon rank-sum test, or Wilcoxon–Mann–Whitney, is used for unpaired samples and is a non-parametric test (it makes no assumptions regarding the distribution or similarity of variances).
Therefore it is less powerful than the unpaired t-test, but you can be more certain that the differences you find between the data are real.
The Mann–Whitney U test is performed by converting your data into ranks and analyzing the difference between the rank totals, providing a statistic, U. The lower the U, the less likely differences have occurred by chance.
Determining if something is significant with the Mann-Whitney U test involves using different tables that provide a critical value of U for a particular significance level. The critical value varies depending on the significance level chosen as well as the number of participants in each group (which is not required to be equal for this test).
Student’s t-test and the Mann–Whitney U test Compared
Here’s a simple comparison of the two methods we’ve just discussed.
Table 1. Comparison of the Student’s t-test and the Mann–Whitney U test.
Test | Paired or Unpaired Data | Requirements and Properties |
Student's t-test | Both. Choose as appropriate | Data must follow the normal distribution. Data must be continuous. Variance of the two datasets must be the same. |
Mann–Whitney U test | Unpaired | Data can be continuous or ordinal. Assumes the samples being compared are independant. Assumes the sample sizes are similar. Results could be biased towards the larger sample. |
Comparing Two Sets of Data Summarized
We’ve learned what the two main methods are, their data requirements, and some of their assumptions.
Use them to quantify how confident people can be that your results are accurate and reliable and convey their significance.
Alternatively, use them to optimize your experiments by selecting the best sample size and focusing on meaningful outcomes.
Let us know in the comments if you’ve found this article helpful.
Originally published February 2014. Revised and updated March 2023
1 Comments
Leave a Comment
You must be logged in to post a comment.
Hi Laura,
Thanks for putting all the details in a layman-friendly explanation. I do not know if you still maintain the comment threads, but do you know of any way that I can formally differentiate two sets of data, with a numerical “score” that quantifies the amount of difference? I have read a few articles, and seems like the best bet is KL divergence. What do you think?